Matplotlib Bars
Creating Bars
With Pyplot, you can use the bar() function
to draw bar graphs:
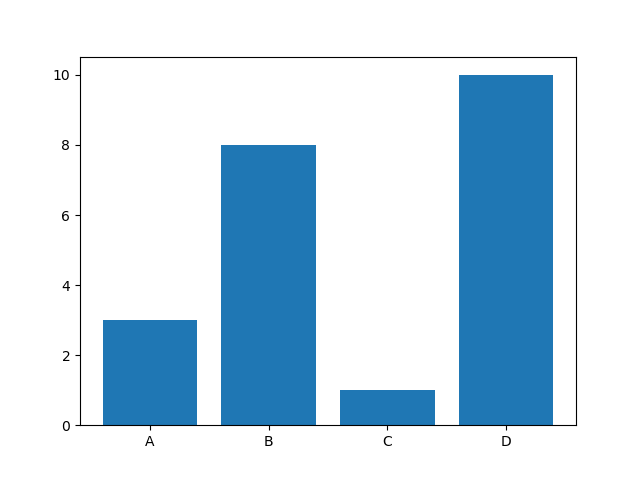
Example
Draw 4 bars:
import matplotlib.pyplot as plt
import numpy as np
x = np.array(["A",
"B", "C", "D"])
y = np.array([3, 8, 1, 10])
plt.bar(x,y)
plt.show()
Result:
The bar() function takes arguments that describes the
layout of the bars.
The categories and their values represented by the first and second argument as arrays.
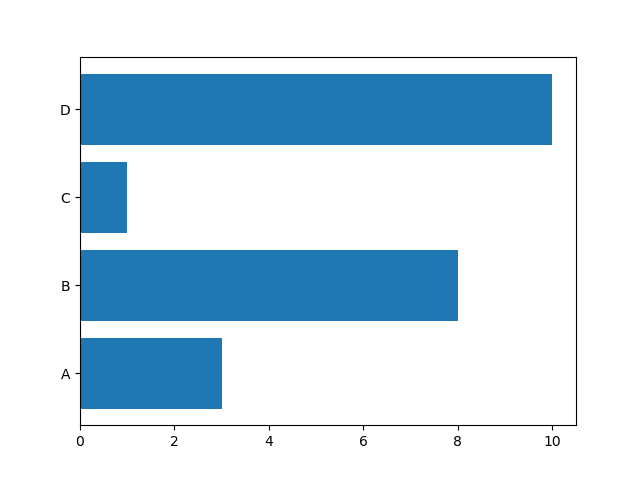
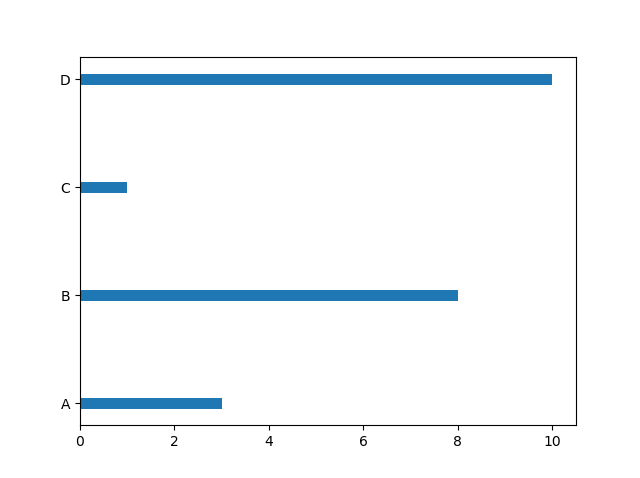
Horizontal Bars
If you want the bars to be displayed horizontally instead of vertically,
use the barh() function:
Example
Draw 4 horizontal bars:
import matplotlib.pyplot as plt
import numpy as np
x = np.array(["A",
"B", "C", "D"])
y = np.array([3, 8, 1, 10])
plt.barh(x, y)
plt.show()
Result:
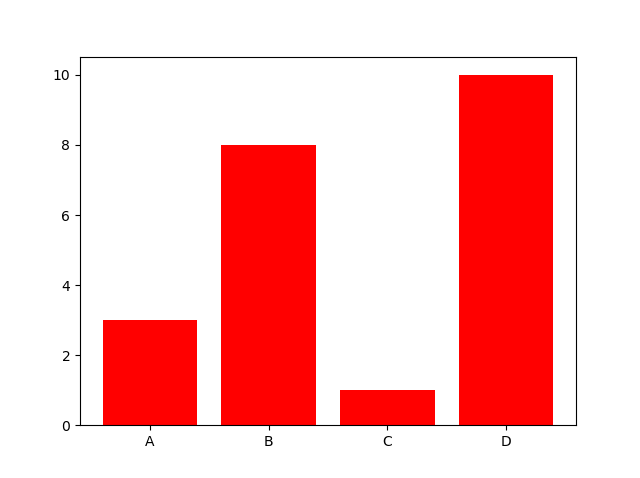
Bar Color
The bar() and barh() take the keyword argument
color to set the color of the bars:
Example
Draw 4 red bars:
import matplotlib.pyplot as plt
import numpy as np
x = np.array(["A",
"B", "C", "D"])
y = np.array([3, 8, 1, 10])
plt.bar(x, y, color = "red")
plt.show()
Result:
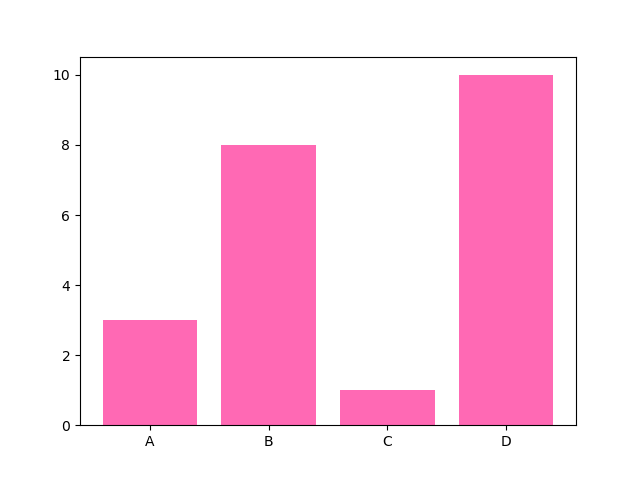
Color Names
You can use any of the 140 supported color names.
Example
Draw 4 "hot pink" bars:
import matplotlib.pyplot as plt
import numpy as np
x = np.array(["A",
"B", "C", "D"])
y = np.array([3, 8, 1, 10])
plt.bar(x, y, color = "hotpink")
plt.show()
Result:
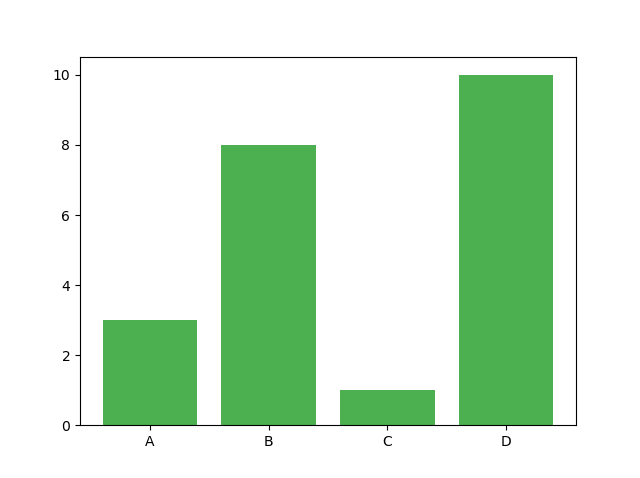
Color Hex
Or you can use Hexadecimal color values:
Example
Draw 4 bars with a beautiful green color:
import matplotlib.pyplot as plt
import numpy as np
x = np.array(["A",
"B", "C", "D"])
y = np.array([3, 8, 1, 10])
plt.bar(x, y, color = "#4CAF50")
plt.show()
Result:
Bar Width
The bar() takes the keyword argument
width to set the width of the bars:
Example
Draw 4 very thin bars:
import matplotlib.pyplot as plt
import numpy as np
x = np.array(["A",
"B", "C", "D"])
y = np.array([3, 8, 1, 10])
plt.bar(x, y, width = 0.1)
plt.show()
Result:
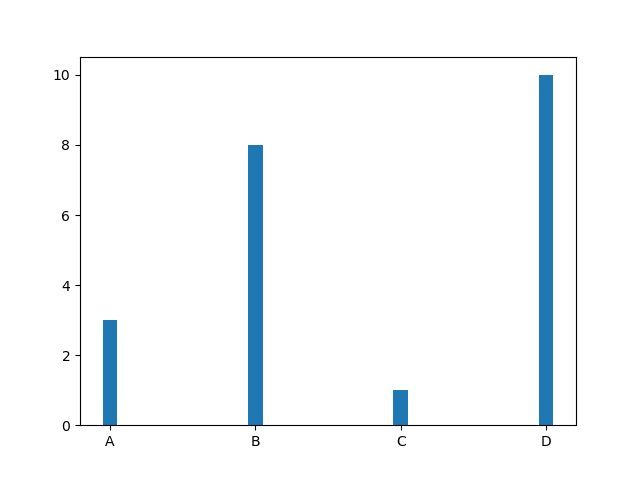
The default width value is 0.8
Note: For horizontal bars, use height instead of width.
Bar Height
The barh() takes the keyword argument
height to set the height of the bars:
Example
Draw 4 very thin bars:
import matplotlib.pyplot as plt
import numpy as np
x = np.array(["A",
"B", "C", "D"])
y = np.array([3, 8, 1, 10])
plt.barh(x, y, height = 0.1)
plt.show()
Result:
The default height value is 0.8

