Poisson Distribution
Poisson Distribution
Poisson Distribution is a Discrete Distribution.
It estimates how many times an event can happen in a specified time. e.g. If someone eats twice a day what is the probability he will eat thrice?
It has two parameters:
lam - rate or known number of occurrences e.g. 2 for above problem.
size - The shape of the returned array.
Example
Generate a random 1x10 distribution for occurrence 2:
from numpy import random
x = random.poisson(lam=2, size=10)
print(x)
Try it Yourself »
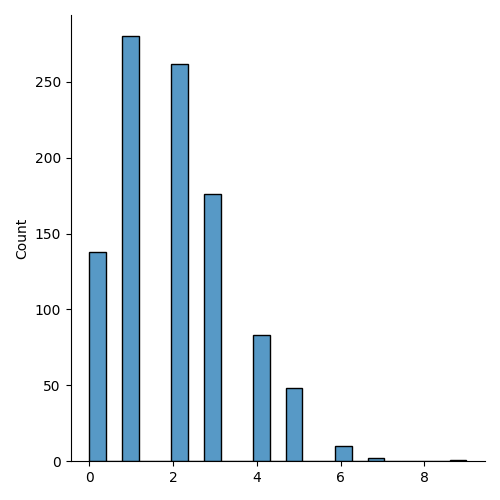
Visualization of Poisson Distribution
Example
from numpy import random
import matplotlib.pyplot as plt
import seaborn as sns
sns.displot(random.poisson(lam=2, size=1000))
plt.show()
Result
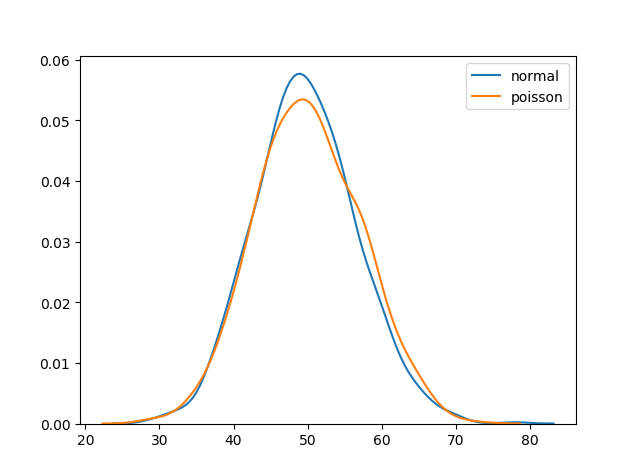
Difference Between Normal and Poisson Distribution
Normal distribution is continuous whereas poisson is discrete.
But we can see that similar to binomial for a large enough poisson distribution it will become similar to normal distribution with certain std dev and mean.
Example
from numpy import random
import matplotlib.pyplot as plt
import seaborn as sns
data = {
"normal": random.normal(loc=50, scale=7, size=1000),
"poisson": random.poisson(lam=50, size=1000)
}
sns.displot(data,
kind="kde")
plt.show()
Result
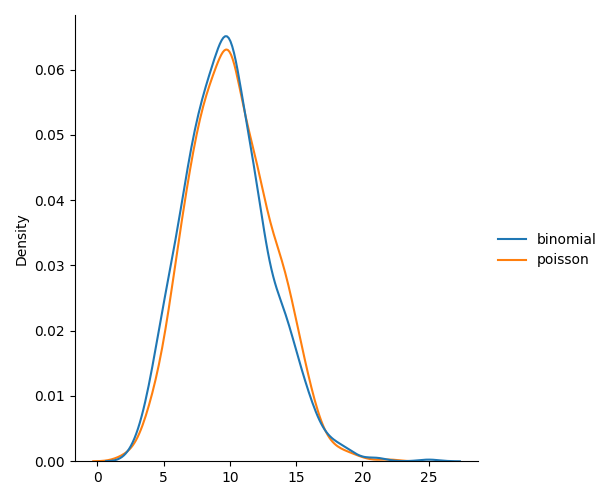
Difference Between Binomial and Poisson Distribution
Binomial distribution only has two possible outcomes, whereas poisson distribution can have unlimited possible outcomes.
But for very large n and near-zero p binomial
distribution is near identical to poisson distribution such that n * p is nearly equal to lam.
Example
from numpy import random
import matplotlib.pyplot as plt
import seaborn as sns
data = {
"binomial": random.binomial(n=1000, p=0.01, size=1000),
"poisson": random.poisson(lam=10, size=1000)
}
sns.displot(data,
kind="kde")
plt.show()
Result