Seaborn
Visualize Distributions With Seaborn
Seaborn is a library that uses Matplotlib underneath to plot graphs. It will be used to visualize random distributions.
Install Seaborn.
If you have Python and PIP already installed on a system, install it using this command:
C:\Users\Your Name>pip install seaborn
If you use Jupyter, install Seaborn using this command:
C:\Users\Your Name>!pip install seaborn
Displots
Displot stands for distribution plot, it takes as input an array and plots a curve corresponding to the distribution of points in the array.
Import Matplotlib
Import the pyplot object of the Matplotlib module in your code using the following statement:
import matplotlib.pyplot as plt
You can learn about the Matplotlib module in our Matplotlib Tutorial.
Import Seaborn
Import the Seaborn module in your code using the following statement:
import seaborn as sns
Plotting a Displot
Example
import matplotlib.pyplot as plt
import seaborn as sns
sns.displot([0, 1,
2, 3, 4, 5])
plt.show()
Try it Yourself »
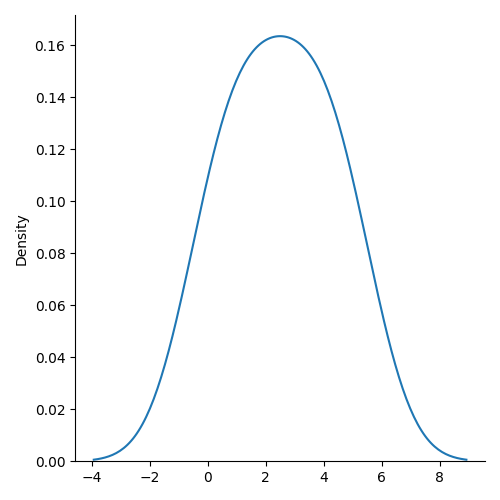
Plotting a Displot Without the Histogram
Example
import matplotlib.pyplot as plt
import seaborn as sns
sns.displot([0, 1,
2, 3, 4, 5], kind="kde")
plt.show()
Try it Yourself »
Note: We will be using: sns.displot(arr, kind="kde") to visualize random distributions in this tutorial.
