Menu
×
   ❮     
HTML CSS JAVASCRIPT SQL PYTHON JAVA PHP HOW TO W3.CSS C C++ C# BOOTSTRAP REACT MYSQL JQUERY EXCEL XML DJANGO NUMPY PANDAS NODEJS R TYPESCRIPT ANGULAR GIT POSTGRESQL MONGODB ASP AI GO KOTLIN SASS VUE DSA GEN AI SCIPY AWS CYBERSECURITY DATA SCIENCE
     ❯   

Python Tutorial

Python HOME Python Intro Python Get Started Python Syntax Python Comments Python Variables Python Data Types Python Numbers Python Casting Python Strings Python Booleans Python Operators Python Lists Python Tuples Python Sets Python Dictionaries Python If...Else Python While Loops Python For Loops Python Functions Python Lambda Python Arrays Python Classes/Objects Python Inheritance Python Iterators Python Polymorphism Python Scope Python Modules Python Dates Python Math Python JSON Python RegEx Python PIP Python Try...Except Python User Input Python String Formatting

File Handling

Python File Handling Python Read Files Python Write/Create Files Python Delete Files

Python Modules

NumPy Tutorial Pandas Tutorial SciPy Tutorial Django Tutorial

Python Matplotlib

Matplotlib Intro Matplotlib Get Started Matplotlib Pyplot Matplotlib Plotting Matplotlib Markers Matplotlib Line Matplotlib Labels Matplotlib Grid Matplotlib Subplot Matplotlib Scatter Matplotlib Bars Matplotlib Histograms Matplotlib Pie Charts

Machine Learning

Getting Started Mean Median Mode Standard Deviation Percentile Data Distribution Normal Data Distribution Scatter Plot Linear Regression Polynomial Regression Multiple Regression Scale Train/Test Decision Tree Confusion Matrix Hierarchical Clustering Logistic Regression Grid Search Categorical Data K-means Bootstrap Aggregation Cross Validation AUC - ROC Curve K-nearest neighbors

Python MySQL

MySQL Get Started MySQL Create Database MySQL Create Table MySQL Insert MySQL Select MySQL Where MySQL Order By MySQL Delete MySQL Drop Table MySQL Update MySQL Limit MySQL Join

Python MongoDB

MongoDB Get Started MongoDB Create DB MongoDB Collection MongoDB Insert MongoDB Find MongoDB Query MongoDB Sort MongoDB Delete MongoDB Drop Collection MongoDB Update MongoDB Limit

Python Reference

Python Overview Python Built-in Functions Python String Methods Python List Methods Python Dictionary Methods Python Tuple Methods Python Set Methods Python File Methods Python Keywords Python Exceptions Python Glossary

Module Reference

Random Module Requests Module Statistics Module Math Module cMath Module

Python How To

Remove List Duplicates Reverse a String Add Two Numbers

Python Examples

Python Examples Python Compiler Python Exercises Python Quiz Python Server Python Bootcamp Python Certificate

Machine Learning - K-means


On this page, W3schools.com collaborates with NYC Data Science Academy, to deliver digital training content to our students.


K-means

K-means is an unsupervised learning method for clustering data points. The algorithm iteratively divides data points into K clusters by minimizing the variance in each cluster.

Here, we will show you how to estimate the best value for K using the elbow method, then use K-means clustering to group the data points into clusters.


How does it work?

First, each data point is randomly assigned to one of the K clusters. Then, we compute the centroid (functionally the center) of each cluster, and reassign each data point to the cluster with the closest centroid. We repeat this process until the cluster assignments for each data point are no longer changing.

K-means clustering requires us to select K, the number of clusters we want to group the data into. The elbow method lets us graph the inertia (a distance-based metric) and visualize the point at which it starts decreasing linearly. This point is referred to as the "eblow" and is a good estimate for the best value for K based on our data.

Example

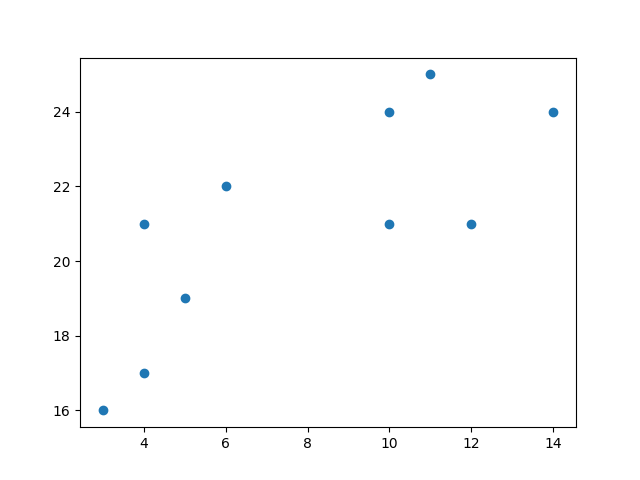
Start by visualizing some data points:

import matplotlib.pyplot as plt

x = [4, 5, 10, 4, 3, 11, 14 , 6, 10, 12]
y = [21, 19, 24, 17, 16, 25, 24, 22, 21, 21]

plt.scatter(x, y)
plt.show()

Result

Run example »

ADVERTISEMENT


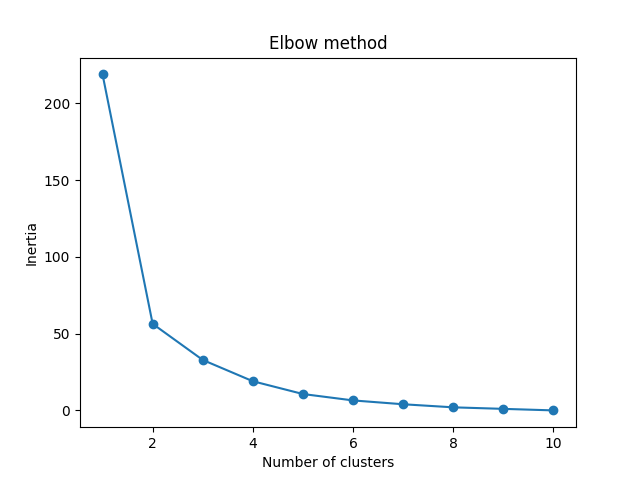
Now we utilize the elbow method to visualize the intertia for different values of K:

Example

from sklearn.cluster import KMeans

data = list(zip(x, y))
inertias = []

for i in range(1,11):
    kmeans = KMeans(n_clusters=i)
    kmeans.fit(data)
    inertias.append(kmeans.inertia_)

plt.plot(range(1,11), inertias, marker='o')
plt.title('Elbow method')
plt.xlabel('Number of clusters')
plt.ylabel('Inertia')
plt.show()

Result

Run example »

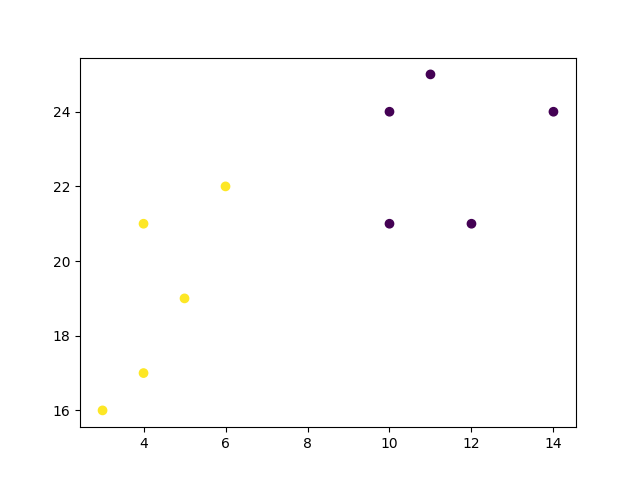
The elbow method shows that 2 is a good value for K, so we retrain and visualize the result:

Example

kmeans = KMeans(n_clusters=2)
kmeans.fit(data)

plt.scatter(x, y, c=kmeans.labels_)
plt.show()

Result

Run example »

Example Explained

Import the modules you need.

import matplotlib.pyplot as plt
from sklearn.cluster import KMeans

You can learn about the Matplotlib module in our "Matplotlib Tutorial.

scikit-learn is a popular library for machine learning.

Create arrays that resemble two variables in a dataset. Note that while we only use two variables here, this method will work with any number of variables:

x = [4, 5, 10, 4, 3, 11, 14 , 6, 10, 12]
y = [21, 19, 24, 17, 16, 25, 24, 22, 21, 21]

Turn the data into a set of points:

data = list(zip(x, y))
print(data)

Result:

[(4, 21), (5, 19), (10, 24), (4, 17), (3, 16), (11, 25), (14, 24), (6, 22), (10, 21), (12, 21)]

In order to find the best value for K, we need to run K-means across our data for a range of possible values. We only have 10 data points, so the maximum number of clusters is 10. So for each value K in range(1,11), we train a K-means model and plot the intertia at that number of clusters:

inertias = []

for i in range(1,11):
    kmeans = KMeans(n_clusters=i)
    kmeans.fit(data)
    inertias.append(kmeans.inertia_)

plt.plot(range(1,11), inertias, marker='o')
plt.title('Elbow method')
plt.xlabel('Number of clusters')
plt.ylabel('Inertia')
plt.show()

Result:

We can see that the "elbow" on the graph above (where the interia becomes more linear) is at K=2. We can then fit our K-means algorithm one more time and plot the different clusters assigned to the data:

kmeans = KMeans(n_clusters=2)
kmeans.fit(data)

plt.scatter(x, y, c=kmeans.labels_)
plt.show()

Result:


×

Contact Sales

If you want to use W3Schools services as an educational institution, team or enterprise, send us an e-mail:
sales@w3schools.com

Report Error

If you want to report an error, or if you want to make a suggestion, send us an e-mail:
help@w3schools.com

W3Schools is optimized for learning and training. Examples might be simplified to improve reading and learning. Tutorials, references, and examples are constantly reviewed to avoid errors, but we cannot warrant full correctness of all content. While using W3Schools, you agree to have read and accepted our terms of use, cookie and privacy policy.

Copyright 1999-2024 by Refsnes Data. All Rights Reserved. W3Schools is Powered by W3.CSS.