Menu
×
   ❮     
HTML CSS JAVASCRIPT SQL PYTHON JAVA PHP HOW TO W3.CSS C C++ C# BOOTSTRAP REACT MYSQL JQUERY EXCEL XML DJANGO NUMPY PANDAS NODEJS R TYPESCRIPT ANGULAR GIT POSTGRESQL MONGODB ASP AI GO KOTLIN SASS VUE DSA GEN AI SCIPY AWS CYBERSECURITY DATA SCIENCE
     ❯   

Data Science - Intro to Statistics


Introduction to Statistics

Statistics is the science of analyzing data.

When we have created a model for prediction, we must assess the prediction's reliability.

After all, what is a prediction worth, if we cannot rely on it?


Descriptive Statistics

We will first cover some basic descriptive statistics.

Descriptive statistics summarizes important features of a data set such as:

  • Count
  • Sum
  • Standard Deviation
  • Percentile
  • Average
  • Etc..

It is a good starting point to become familiar with the data.

We can use the describe() function in Python to summarize the data:

Example

print (full_health_data.describe())
Try it Yourself »

Output:

Stat Describe

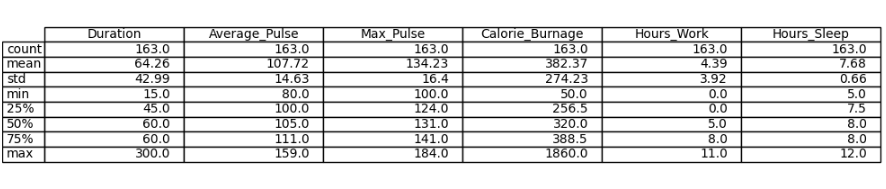
Do you see anything interesting here?


×

Contact Sales

If you want to use W3Schools services as an educational institution, team or enterprise, send us an e-mail:
sales@w3schools.com

Report Error

If you want to report an error, or if you want to make a suggestion, send us an e-mail:
help@w3schools.com

W3Schools is optimized for learning and training. Examples might be simplified to improve reading and learning. Tutorials, references, and examples are constantly reviewed to avoid errors, but we cannot warrant full correctness of all content. While using W3Schools, you agree to have read and accepted our terms of use, cookie and privacy policy.

Copyright 1999-2024 by Refsnes Data. All Rights Reserved. W3Schools is Powered by W3.CSS.