Data Science - Statistics Variance
Variance
Variance is another number that indicates how spread out the values are.
In fact, if you take the square root of the variance, you get the standard deviation. Or the other way around, if you multiply the standard deviation by itself, you get the variance!
We will first use the data set with 10 observations to give an example of how we can calculate the variance:
| Duration | Average_Pulse | Max_Pulse | Calorie_Burnage | Hours_Work | Hours_Sleep |
|---|---|---|---|---|---|
| 30 | 80 | 120 | 240 | 10 | 7 |
| 30 | 85 | 120 | 250 | 10 | 7 |
| 45 | 90 | 130 | 260 | 8 | 7 |
| 45 | 95 | 130 | 270 | 8 | 7 |
| 45 | 100 | 140 | 280 | 0 | 7 |
| 60 | 105 | 140 | 290 | 7 | 8 |
| 60 | 110 | 145 | 300 | 7 | 8 |
| 60 | 115 | 145 | 310 | 8 | 8 |
| 75 | 120 | 150 | 320 | 0 | 8 |
| 75 | 125 | 150 | 330 | 8 | 8 |
Tip: Variance is often represented by the symbol Sigma Square: σ^2
Step 1 to Calculate the Variance: Find the Mean
We want to find the variance of Average_Pulse.
1. Find the mean:
(80+85+90+95+100+105+110+115+120+125) / 10 = 102.5
The mean is 102.5
Step 2: For Each Value - Find the Difference From the Mean
2. Find the difference from the mean for each value:
80 - 102.5 = -22.5
85 - 102.5 = -17.5
90 - 102.5 = -12.5
95 - 102.5 =
-7.5
100 - 102.5 = -2.5
105 - 102.5 = 2.5
110 - 102.5 = 7.5
115 -
102.5 = 12.5
120 - 102.5 = 17.5
125 - 102.5 = 22.5
Step 3: For Each Difference - Find the Square Value
3. Find the square value for each difference:
(-22.5)^2 = 506.25
(-17.5)^2 = 306.25
(-12.5)^2 = 156.25
(-7.5)^2 =
56.25
(-2.5)^2 = 6.25
2.5^2 = 6.25
7.5^2 = 56.25
12.5^2 = 156.25
17.5^2 = 306.25
22.5^2 = 506.25
Note: We must square the values to get the total spread.
Step 4: The Variance is the Average Number of These Squared Values
4. Sum the squared values and find the average:
(506.25 + 306.25 + 156.25 + 56.25 + 6.25 + 6.25 + 56.25 + 156.25 + 306.25 +
506.25) / 10 = 206.25
The variance is 206.25.
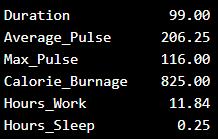
Use Python to Find the Variance of health_data
We can use the var() function from Numpy to find the
variance (remember that we now use the first data set with 10 observations):
The output:
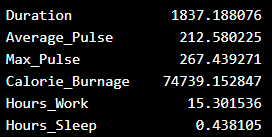
Use Python to Find the Variance of Full Data Set
Here we calculate the variance for each column for the full data set:
The output: