
Playwright Trace Viewer
Playwright Trace Viewer
The Trace Viewer is a Playwright tool that lets you replay a test after it has run, step by step.
It reads a trace: a recording of everything that happened during the test.
A trace is saved as one trace.zip file.
It holds every action, a snapshot of the page before and after each action, the network requests, the console messages and your test code.
Traces are the best way to find out why a test failed, especially a test that failed on another computer, like a CI server (a computer that runs your tests automatically).
Record a Trace
The quickest way to get a trace is the --trace on option, which records a trace for every test:
Example
npx playwright test --trace on
We use this test from the First Test chapter:
Example
tests/todo.spec.js
// @ts-check
import { test, expect } from '@playwright/test';
test('can add a todo', async ({ page }) => {
await page.goto('https://www.w3schools.com/playwright/practice/todo.html');
await page.getByPlaceholder('What needs to be done?').fill('Learn Playwright');
await page.getByRole('button', { name: 'Add' }).click();
await expect(page.getByText('Learn Playwright')).toBeVisible();
await expect(page.getByTestId('todo-count')).toHaveText('1 item left');
});
Output:
Running 1 test using 1 worker
[1/1] [chromium] › tests/todo.spec.js:4:1 › can add a todo
1 passed (2.1s)
The trace is saved in the test-results folder, in a folder named after the test:
test-results/
todo-can-add-a-todo-chromium/
trace.zip
Trace Modes in the Config
Recording a trace for every test makes runs slower and uses disk space.
That is why you usually set the trace option in playwright.config.js to record only when it helps:
Example
playwright.config.js
export default defineConfig({
use: {
trace: 'on-first-retry',
},
});
| Value | What it records |
|---|---|
'off' | No traces. This is the default |
'on' | A trace for every test |
'on-first-retry' | A trace only when a failed test is retried for the first time |
'retain-on-failure' | A trace for every test, but keeps it only when the test fails |
The config from npm init playwright uses 'on-first-retry'.
It works together with retries, which you will learn about in the Retries chapter.
When you run tests without retries, use 'retain-on-failure' to get a trace for every failed test.
To see this, change the last line of the todo test so that it fails:
Example
tests/todo.spec.js
await expect(page.getByTestId('todo-count')).toHaveText('2 items left');
Run it again, and Playwright prints where the trace is and how to open it:
Example
npx playwright test --trace retain-on-failure
Output:
Running 1 test using 1 worker
[1/1] [chromium] › tests/todo.spec.js:4:1 › can add a todo
1) [chromium] › tests/todo.spec.js:4:1 › can add a todo ──────────────────────────────────────────
Error: expect(locator).toHaveText(expected) failed
Locator: getByTestId('todo-count')
Expected: "2 items left"
Received: "1 item left"
Timeout: 5000ms
attachment #2: trace (application/zip) ─────────────────────────────────────────────────────────
test-results/todo-can-add-a-todo-chromium/trace.zip
Usage:
npx playwright show-trace test-results/todo-can-add-a-todo-chromium/trace.zip
────────────────────────────────────────────────────────────────────────────────────────────────
1 failed
[chromium] › tests/todo.spec.js:4:1 › can add a todo ───────────────────────────────────────────
Open the Trace Viewer
Open a trace file with show-trace:
Example
npx playwright show-trace test-results/todo-can-add-a-todo-chromium/trace.zip
The Trace Viewer opens in its own window.
You can also open a trace from the HTML report: click a test, then click its trace.
Tip: Add --port 9322 to serve the Trace Viewer at http://localhost:9322 in your normal browser instead.
You can also drop a trace.zip file on trace.playwright.dev. The trace is opened in your browser and is not uploaded.
Inside the Trace Viewer
This is the trace of the todo test, with the Click action selected:
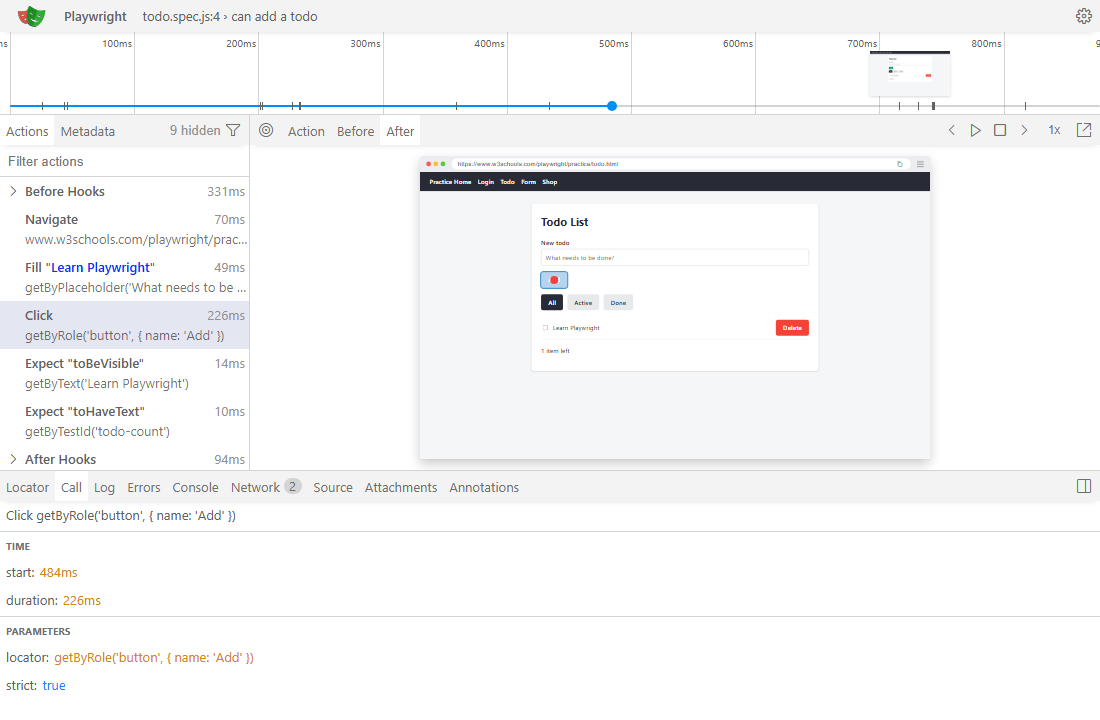
- Timeline (top): small screenshots over time, and you can move the mouse over it to see the page at any moment
- Actions (left): every step of the test, with the locator and how long it took
- Snapshot (middle): the page at the selected action, with the tabs Before, Action and After
- Tabs (bottom): details about the selected action
The snapshots are not images.
They are copies of the real page and its HTML (DOM snapshots).
You can open a snapshot in a new window and inspect it with the browser's developer tools.
The After snapshot above shows the new todo and the text "1 item left".
The Detail Tabs
The tabs at the bottom show everything about the selected action:
| Tab | What it shows |
|---|---|
| Locator | Try out locators against the snapshot |
| Call | The action, its locator, parameters and timing |
| Log | What Playwright did step by step, like waiting for the element |
| Errors | The error message, if the action failed |
| Console | Messages the page wrote to the browser console |
| Network | Every request the page made, with status, type, size and time |
| Source | Your test file, with the current line highlighted |
| Attachments | Screenshots and other files attached to the test |
Here is the same Click action with the Before snapshot and the Log tab:
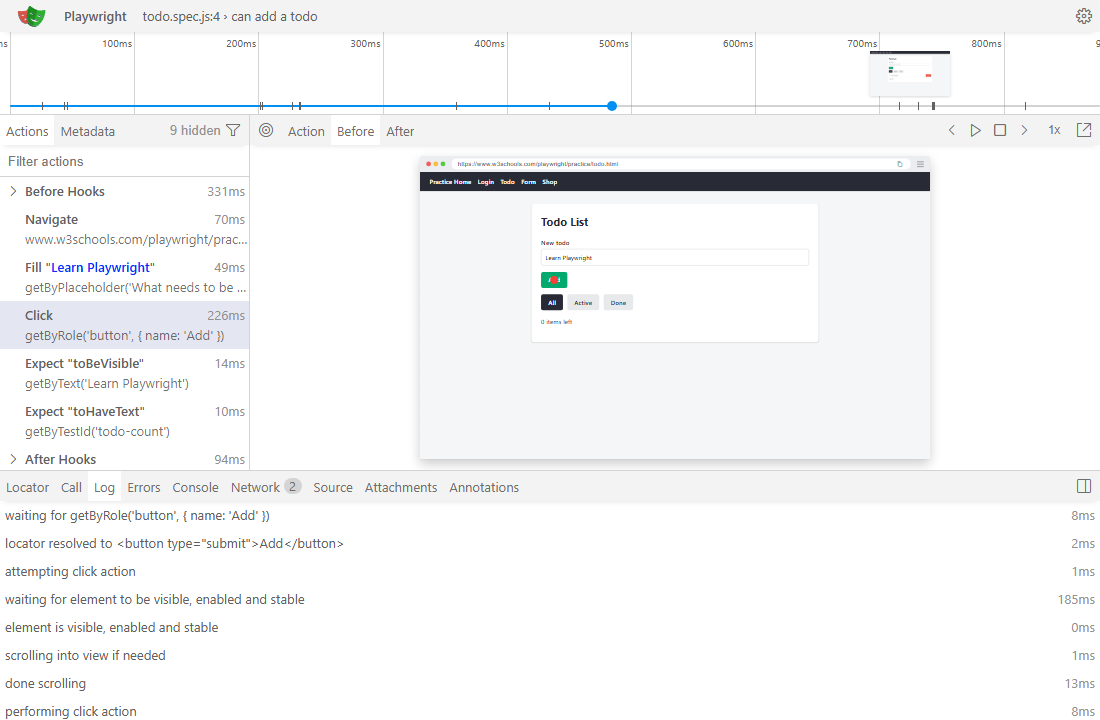
The red dot on the Add button shows where Playwright clicked.
The log shows the auto-waiting from the Auto-Waiting chapter: Playwright waited until the button was visible, enabled and stable, and then clicked.







