Distribution
- What is Normal Distribution?
- What is Margin of Error?
- What is Skewness?
- What is Kurtosis?
Normal Distribution
The Normal Distribution Curve is a bell-shaped curve.
Each band of the curve has a width of 1 Standard Deviation:

Each band of the curve has a width of 1 Standard deviation from the Mean Value.
Values less than 1 Standard Deviation away account for 68.27%.
Values less than 2 standard deviations away account for 95.45%.
Values less than 3 standard deviations away account for 99.73%.
What does it mean?
Most observations are within 1 standard deviation from the mean.
Almost all observations are within 2 standard deviations.
Practically all observations are within 3 standard deviations.
Normal Distribution Facts
Normal distribution is Symmetric. The peak always divides the distribution in half.
Normal distribution is a Probability distribution.
A lot of observations follow the normal distribution:
- Your IQ
- Your Weight
- Your Height
- Your Salary
- Your Blood Pressure
Normal distribution shows that values near the mean are more frequent than values far from the mean:
| Distance from the Mean Value | Percentage of the Population |
|---|---|
| 1 Standard deviation | 68.27% |
| 2 Standard deviations | 95.45% |
| 3 Standard deviations | 99.73% |
The 68–95–99.7 Rule (aka The Empirical Rule), is a shorthand to remember the percentage of values that lie within the different bands of a normal distribution.
Normal distribution is also known as the Gaussian Distribution and the Bell Curve.
The Margin of Error
Statisticians will always try to predict everything with 100% accuracy.
But, there will always be some uncertainty.
The Margin of Error is the number that quantifies this statistical uncertainty.
Different margins define different ranges for where we believe the correct answers can be found.
The acceptable margin is a matter of judgment, and relative to how important the answer is.
The more samples we collect, the lower the margin of error is:

How to Interpret Margin of Error
Suppose 55% of a sampled population say they plan to vote "Yes".
When projecting this to a whole population, you add/subtract the margin of error to give a range of possible results.
With a margin of error of 3%, you are confident that between 52% and 58% will vote "Yes".
With a margin of error of 10%, you are confident that between 45% and 65% will vote "Yes".
Skewness
Skewness is a distortion (an asymmetry) from the bell curve (normal distribution).
.svg)
Kurtosis
Kurtosis is a also a distortion from the normal distribution (bell curve).
While skewness describes a unexpected values in one tail, kurtosis describes unexpected values in both tails.
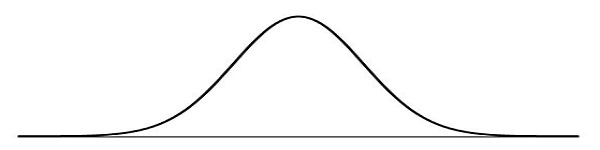
Image: Negative kurtosis (lower than normal distribution).
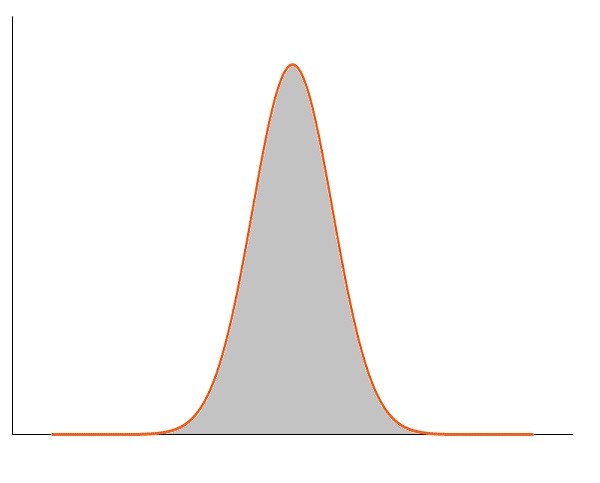
Image: Positive kurtosis (higher than normal distribution).
