Linear Regressions
A Regression is a method to determine the relationship between one variable (y) and other variables (x).
In statistics, a Linear Regression is an approach to modeling a linear relationship between y and x.
In Machine Learning, a Linear Regression is a supervised machine learning algorithm.
Scatter Plot
This is the scatter plot (from the previous chapter):
Example
const xArray = [50,60,70,80,90,100,110,120,130,140,150];
const yArray = [7,8,8,9,9,9,10,11,14,14,15];
// Define Data
const data = [{
x:xArray,
y:yArray,
mode: "markers"
}];
// Define Layout
const layout = {
xaxis: {range: [40, 160], title: "Square Meters"},
yaxis: {range: [5, 16], title: "Price in Millions"},
title: "House Prices vs. Size"
};
Plotly.newPlot("myPlot", data, layout);
Try it Yourself »
Predicting Values
From the scattered data above, how can we predict future prices?
- Use hand drawn linear graph
- Model a linear relationship
- Model a linear regression
Linear Graphs
This is a linear graph predicting prices based on the lowest and the highest price:
Example
const xArray = [50,60,70,80,90,100,110,120,130,140,150];
const yArray = [7,8,8,9,9,9,9,10,11,14,14,15];
const data = [
{x:xArray, y:yArray, mode:"markers"},
{x:[50,150], y:[7,15], mode:"line"}
];
const layout = {
xaxis: {range: [40, 160], title: "Square Meters"},
yaxis: {range: [5, 16], title: "Price in Millions"},
title: "House Prices vs. Size"
};
Plotly.newPlot("myPlot", data, layout);
Try it Yourself »
From a Previous Chapter
A linear graph can be written as y = ax + b
Where:
- y is the price we want to predict
- a is the slope of the line
- x are the input values
- b is the intercept
Linear Relationships
This Model predicts prices using a linear relationship between price and size:
Example
const xArray = [50,60,70,80,90,100,110,120,130,140,150];
const yArray = [7,8,8,9,9,9,10,11,14,14,15];
// Calculate Slope
let xSum = xArray.reduce(function(a, b){return a + b;}, 0);
let ySum = yArray.reduce(function(a, b){return a + b;}, 0);
let slope = ySum / xSum;
// Generate values
const xValues = [];
const yValues = [];
for (let x = 50; x <= 150; x += 1) {
xValues.push(x);
yValues.push(x * slope);
}
Try it Yourself »
In the example above, the slope is a calculated average and the intercept = 0.
Using a Linear Regression Function
This Model predicts prices using a linear regression function:
Example
const xArray = [50,60,70,80,90,100,110,120,130,140,150];
const yArray = [7,8,8,9,9,9,10,11,14,14,15];
// Calculate Sums
let xSum=0, ySum=0 , xxSum=0, xySum=0;
let count = xArray.length;
for (let i = 0, len = count; i < count; i++) {
xSum += xArray[i];
ySum += yArray[i];
xxSum += xArray[i] * xArray[i];
xySum += xArray[i] * yArray[i];
}
// Calculate slope and intercept
let slope = (count * xySum - xSum * ySum) / (count * xxSum - xSum * xSum);
let intercept = (ySum / count) - (slope * xSum) / count;
// Generate values
const xValues = [];
const yValues = [];
for (let x = 50; x <= 150; x += 1) {
xValues.push(x);
yValues.push(x * slope + intercept);
}
Try it Yourself »
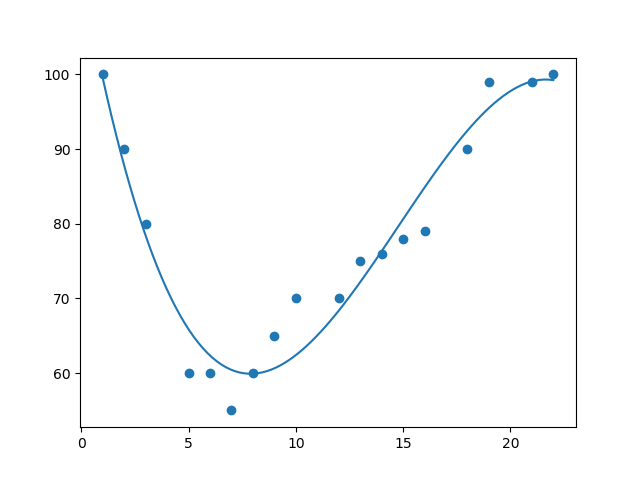
Polynomial Regression
If scattered data points do not fit a linear regression (a straight line through the points), the data may fit an polynomial regression.
A Polynomial Regression, like linear regression,
uses the relationship between the variables x and y to find the best way to draw a line through the data points.