Excel Above and Below Average Rules
Above and Below Average Rules
Above and Below Average Rules are premade types of conditional formatting in Excel used to change the appearance of cells in a range based on your specified conditions.
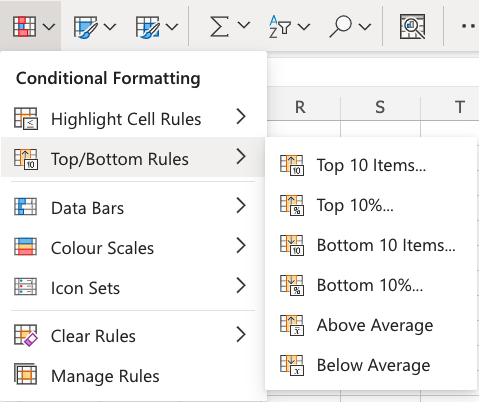
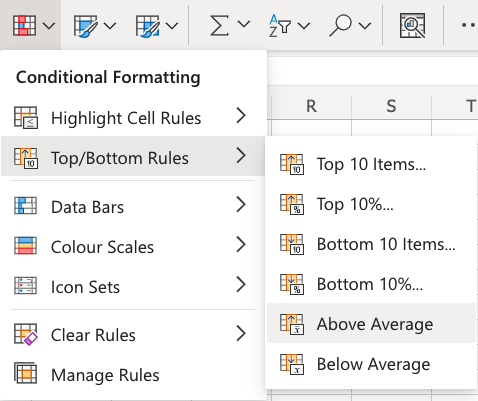
Above and Below Average Rules are found in the Top/Bottom Rules part of the conditional formatting menu:
Appearance Options
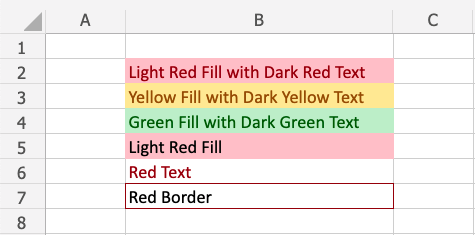
The web browser version of Excel offers the following appearance options for conditionally formatted cells:
- Light Red Fill with Dark Red Text
- Yellow Fill with Dark Yellow Text
- Green Fill with Dark Green Text
- Light Red Fill
- Red Text
- Red Border
Here is how the options look in a spreadsheet:
Above and Below Average Example
The "Above Average" rule will highlight cells with one of the appearance options based on the cell value being the above the average value in a range.
Note: You can use Excel to calcluate the the average value of a range, like in the example data below:
Example
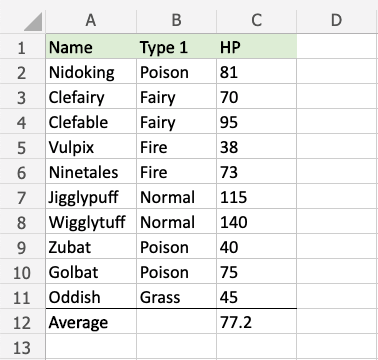
Note: The Average value row is separated from the data with a visual border. Check out how to add this in the format borders chapter.
You can choose any range for where the Highlight Cell Rule should apply. It can be a few cells, a single column, a single row, or a combination of multiple cells, rows and columns.
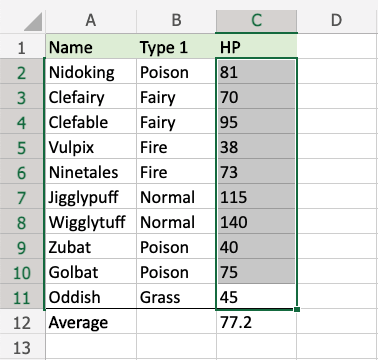
Let's first apply the Above Average rule to the HP values.
"Above Average" Rule, step by step:
- Select the range
C2:C11for HP values
- Click on the Conditional Formatting icon
 in the ribbon, from Home menu
 - Select Top/Bottom Rules from the drop-down menu
- Select Above Average from the menu
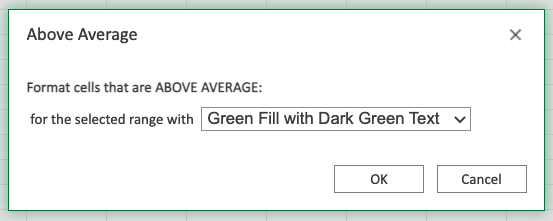
This will open a dialog box where you can specify the value and the appearance option.
- Select the appearance option "Green Fill with Dark Green Text" from the dropdown menu
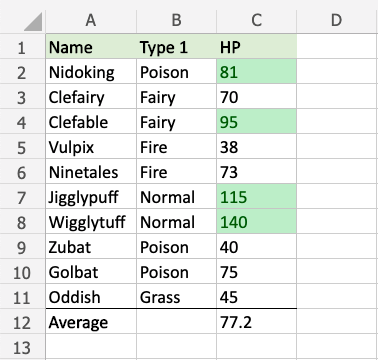
Now, the cells with above average HP values (more than 77.2) will be highlighted in green:
Let's try the same with the below average HP values.
Note: Multiple rules can be applied to the same range.
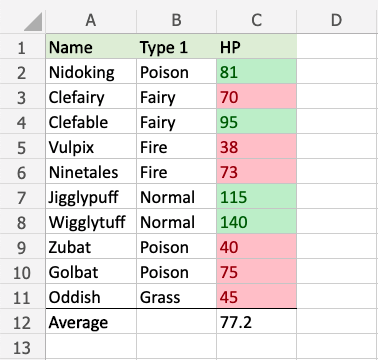
Repeat the steps, but instead choose Below Average in the menu and select the "Light Red Fill with Dark Red Text" appearance option.
Now, the below average values are also highlighted:
Note: You can remove the Highlight Cell Rules with Manage Rules.
Notice that there are more below average values than above average values. Why could this be?
The number of above or below average value cells in a range will depend on the actual values in the range.
If some values in the range are extra large this will increase the average by a lot.
Let's add a fictional Pokemon with a very high HP stat value to illustrate this:
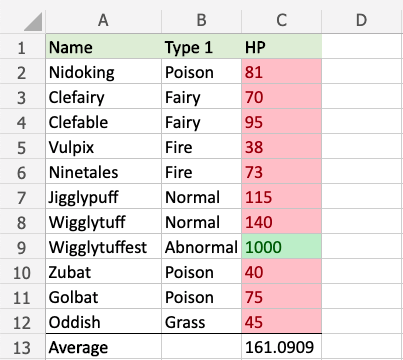
The fictional Wigglytuffest has 1000 HP, which increases the average value all the way up to more than 161.
Now, only Wigglytuffest has an above average HP stat value, and every other Pokemon has below average HP stat values.
Note: This kind of average value is referred to as the mean.
You can learn more about different kinds of average values are calculated in the Statistics - Average chapter.
