Excel Tables
Table
Ranges can be converted into tables.
Tables make it easier to structure and organize data.
Note: The filter function is similar to a table. The filter can be better used if the only function needed is to sort and filter data.
Tables connect cells in a range and put it into a fixed structure.
The cells in the table range share the same formatting.
Note: Tables can be used to prepare data for charts and pivot tables.
Tables allow for options such as:
- Sort & Filter
- Formatting
- AutoFilling
Note: Tables can be converted back to range.
Example
Formatting a range into a table will give it a new form with a fixed structure. Tables open access to new functionality such as: filtering, automations and styling.
Example (Converting a Range to Table)
How to convert range to table, step by step.
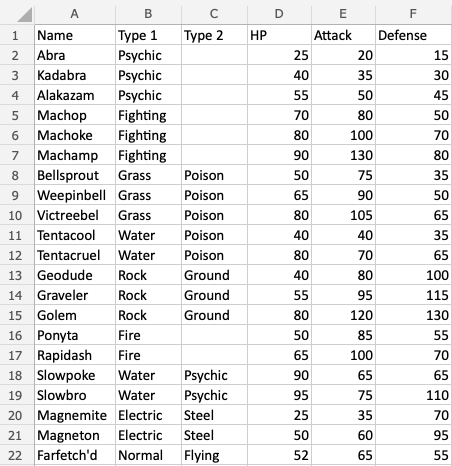
Copy the values to follow along:
Example
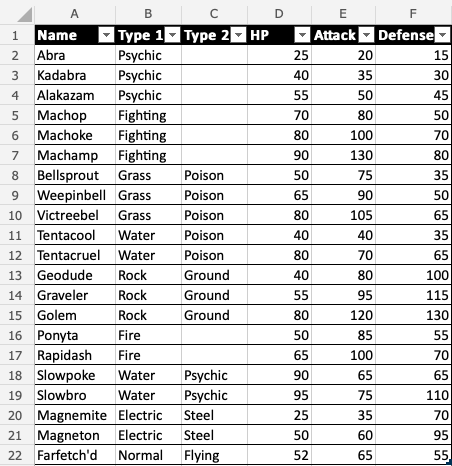
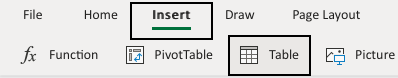
- Select range
A1:F22
- Click Insert, then Table (
 ), in the Ribbon.
- Click OK
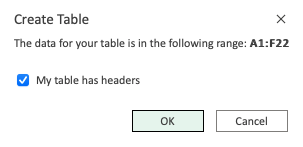
Note: The range (A1:F22) already has headers in row 1. Unchecking the "My table has headers" option allows you to create a dedicated header if you do not already have it.
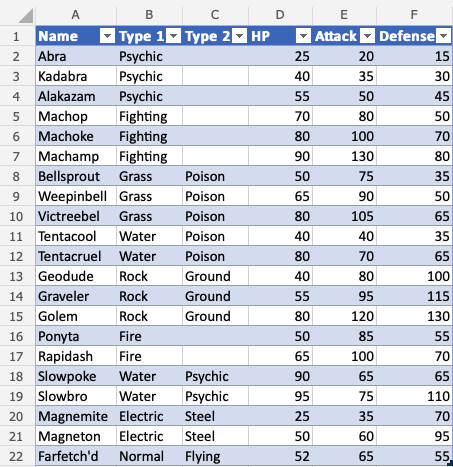
Good job! The range A1:F22 was successfully converted from range to table.
The range is now a fixed table structure and new options such as sorting and filtering are now enabled.
Applying the filter keeps the relationship between the columns while sorting and filtering.
In the next chapter you will learn about Table Design.
