Excel STDEV.P Function
STDEV.P Function
The STDEV.P function is a premade function in Excel, which calculates the Standard Deviation (Std) for the entire population.
It is typed =STDEV.P
Note: This function ignores cells with text and logic.
Note: Standard deviation (σ) measures how far a 'typical' observation is from the average of the data (μ). You can read more about standard deviation in our Statistics - Standard Deviation Tutorial.
Tip: There is another function called STDEV.S that can be used if you have the data for a sample.
How to use the =STDEV.P function:
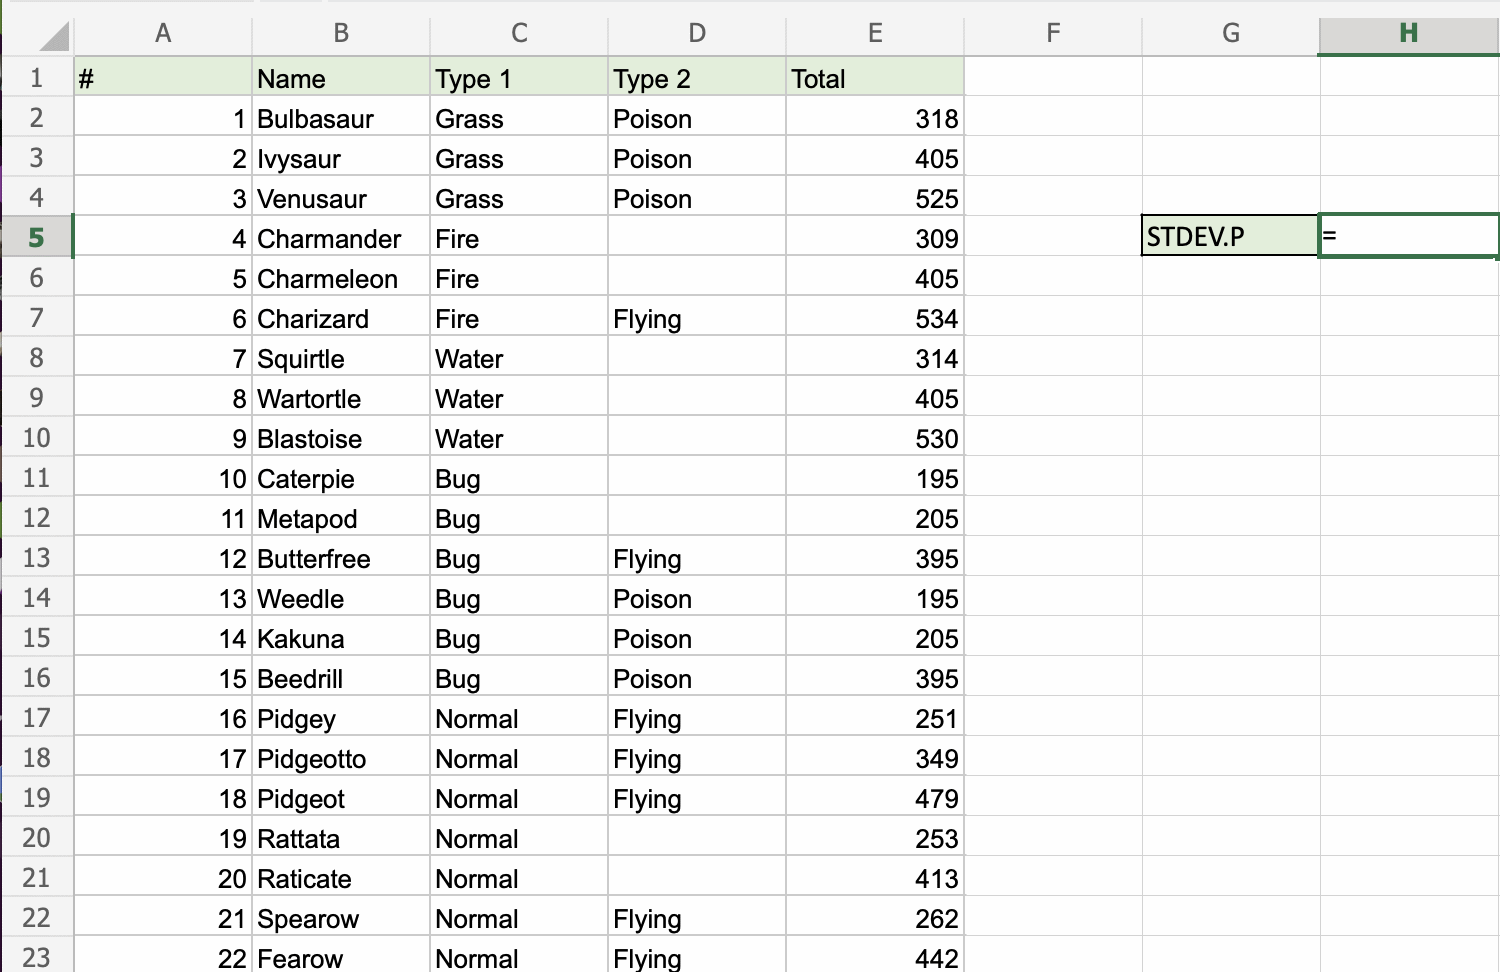
- Select a cell (
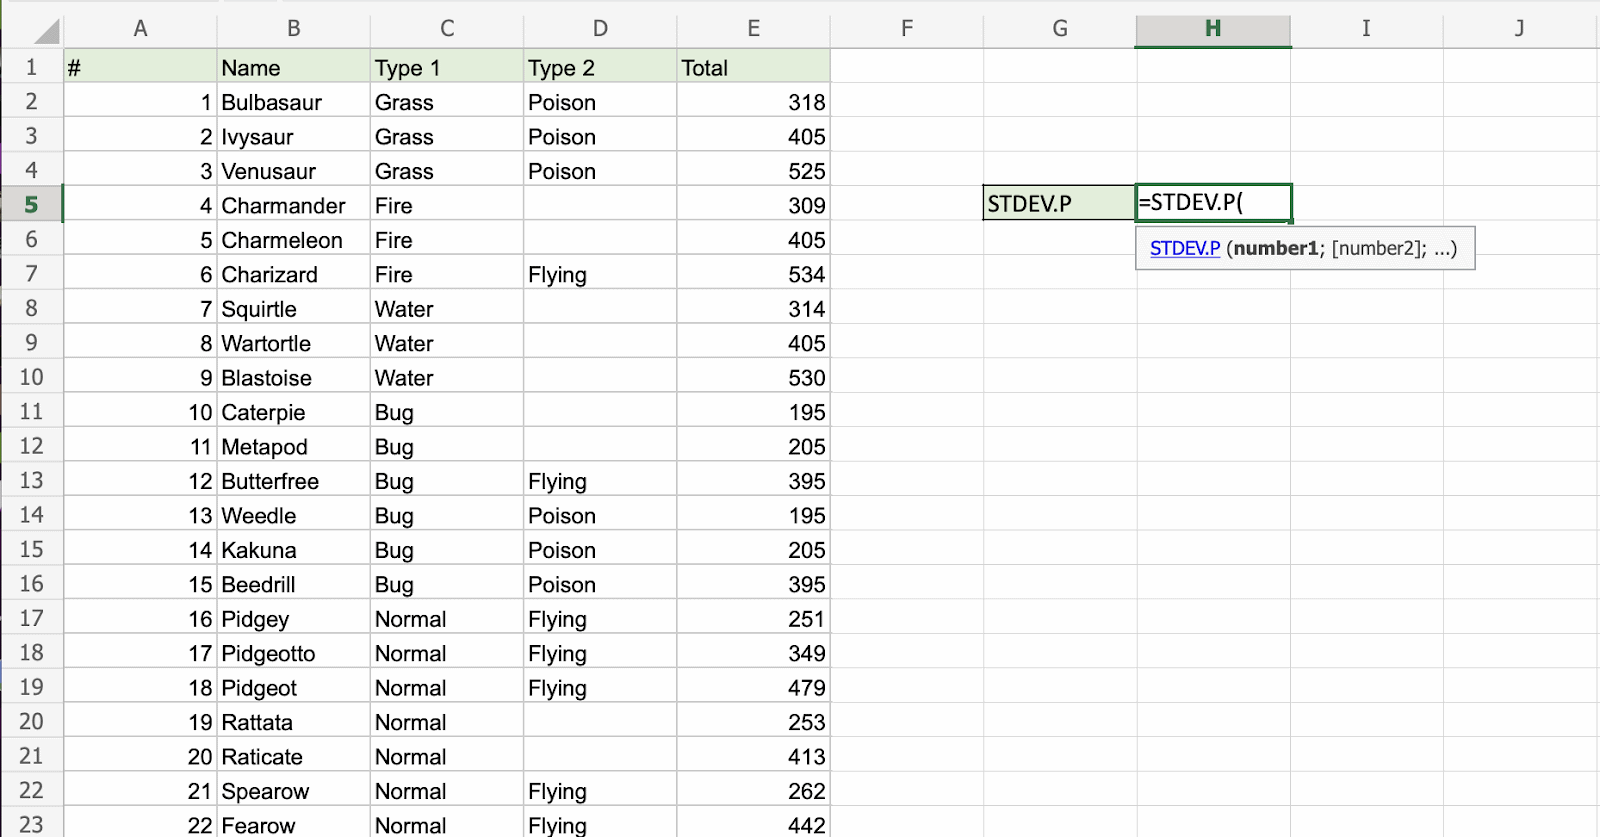
H5) - Type
=STDEV.P - Double click the STDEV.P command
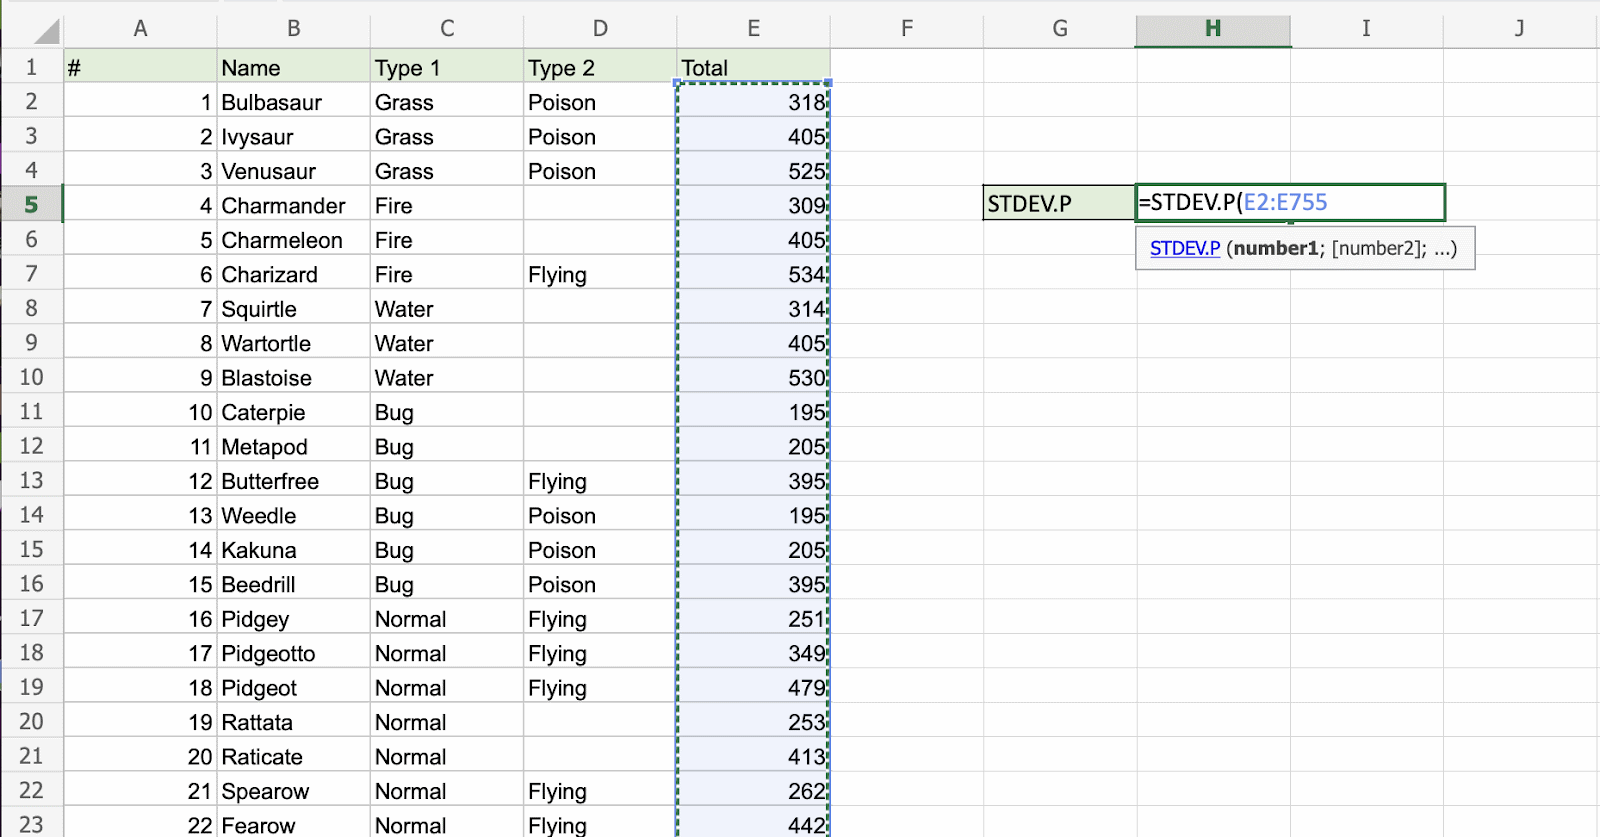
- Select a range (
E2:E755), including all Pokemons - Hit enter
Let's have a look at an example!
Find the Standard Deviation of Pokemon total stats in the range E2:E755:
The picture is not showing all rows. The range is E2:E755 (753 rows).
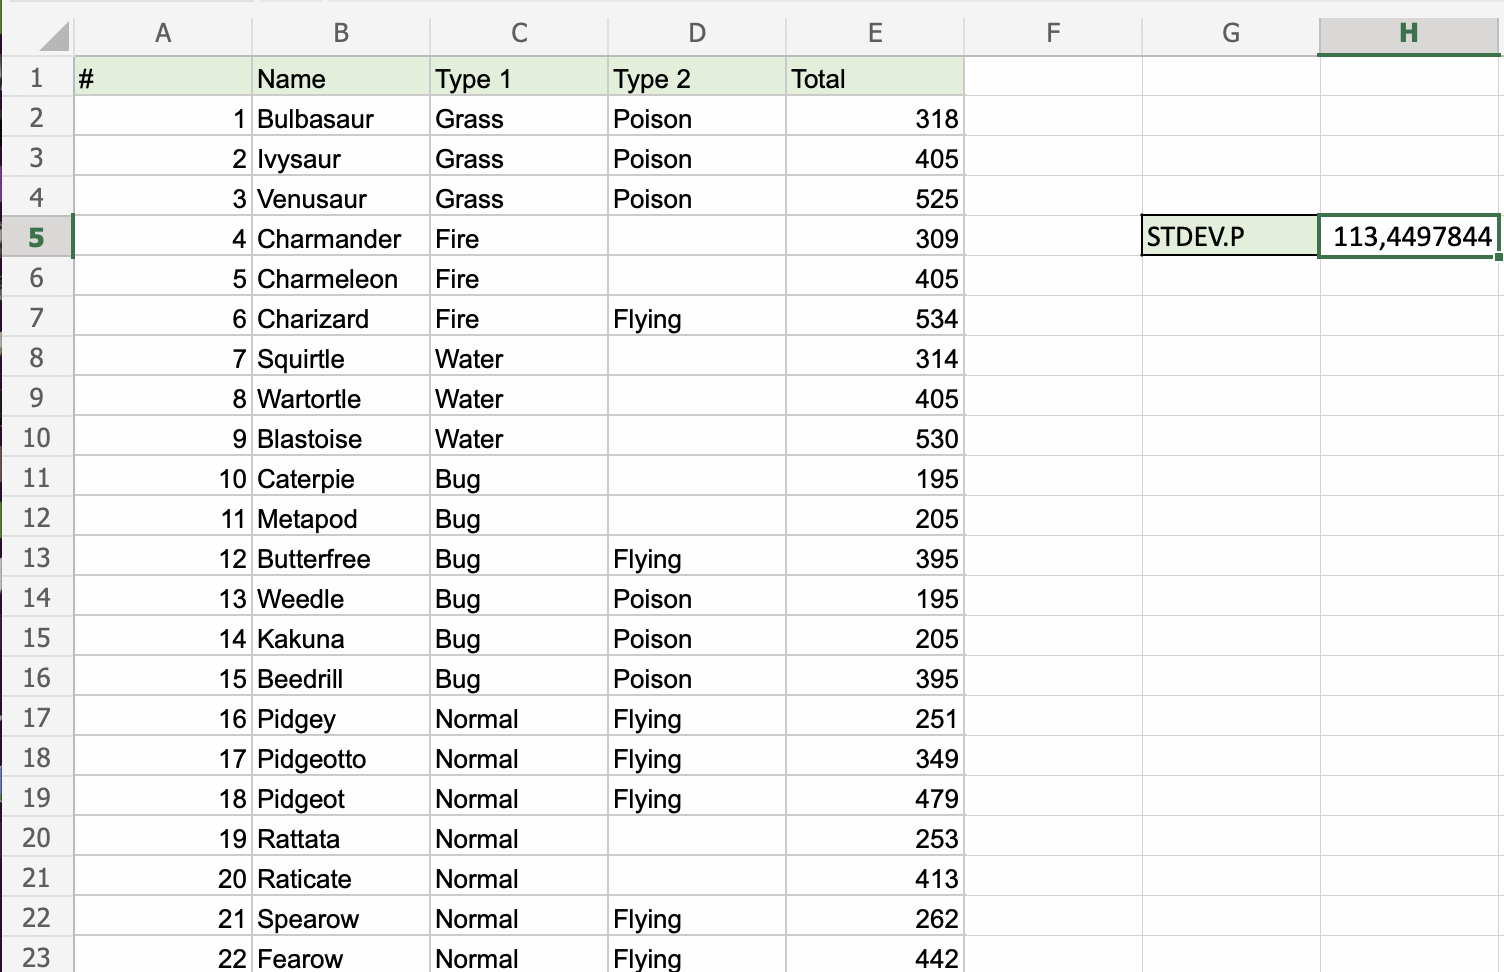
The STDEV.P function has successfully returned the Standard Deviation for the whole population as 113,4497844.
