Excel Color Scales
Color Scales
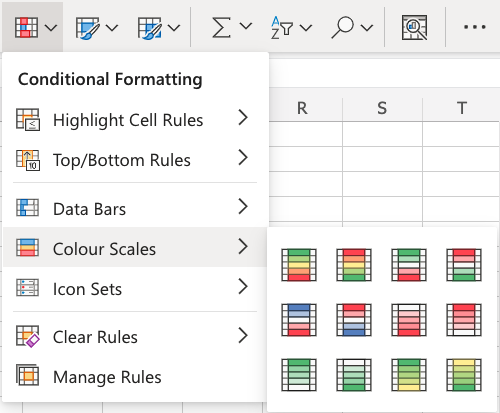
Color Scales are premade types of conditional formatting in Excel used to highlight cells in a range to indicate how large the cell values are compared to the other values in the range.
Here is the Color Scales part of the conditional formatting menu:
Color Scale Formatting Example
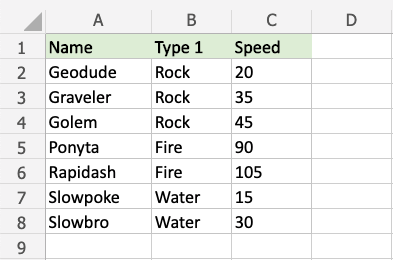
Highlight the Speed values of each Pokemon with Color Scale conditional formatting.
Example
Color Scales, step by step:
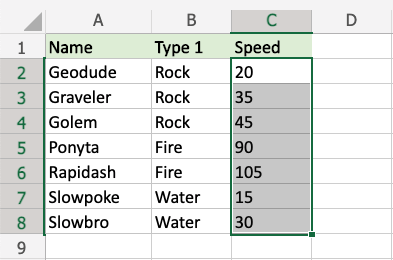
- Select the range of Speed values
C2:C8
- Click on the Conditional Formatting icon
 in the ribbon, from the Home menu
 - Select Color Scales from the drop-down menu
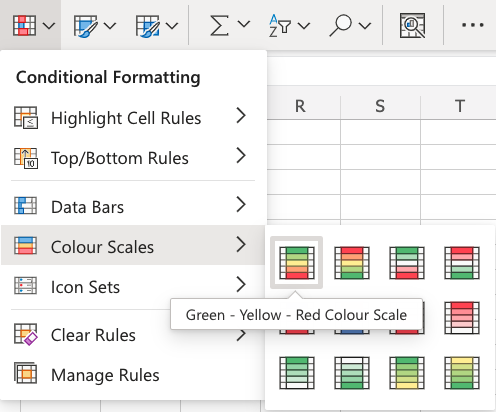
There are 12 Color Scale options with different color variations.
The color on the top of the icon ![]() will apply to the highest values.
will apply to the highest values.
- Click on the "Green - Yellow - Red Colour Scale" icon
Now, the Speed value cells will have a colored background highlighting:
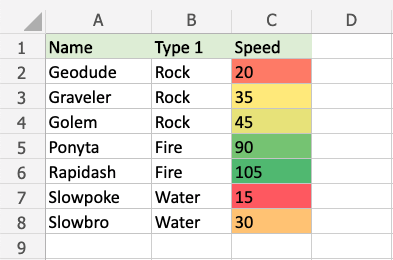
Dark green is used for the highest values, and dark red for the lowest values.
Rapidash has the highest Speed value (105) and Slowpoke has the lowest Speed value (15).
All the cells in the range gradually change color from green, yellow, orange, then red.
Note: The color formatting is relative to the smallest and largest cell values in the range.
Let's see what happens if we add a fictional Pokemon with an even slower Speed value than Slowpoke:
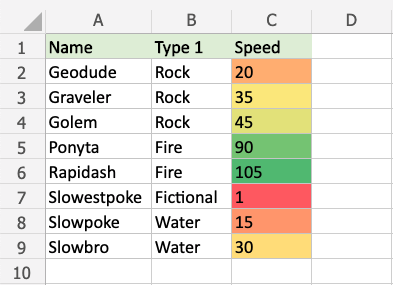
Now, the fictional Slowestpoke has the lowest Speed value of 1, which is highlighted in dark red.
Notice that the color of Slowpoke's Speed value now is highlighted in orange instead of dark red.
Let's see what happens if we add another fictional Pokemon that is faster than any of the other Pokemon:
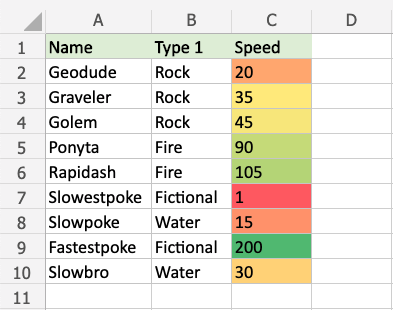
The fictional Fastestpoke has a higher Speed value (200) than any of the other pokemon and is highlighted in dark green.
Rapidash' Speed value of 105 is no longer the highest value and is highlighted with a lighter green.
Notice that the Speed values of the other Pokemon also change as the highest value in the range is now 200 instead of 105.
Note: You can remove the Highlight Cell Rules with Manage Rules.
