
Power BI Card and KPI Visuals
Show the Key Numbers
Some numbers are so important that they deserve their own visual: total sales, profit, the number of orders.
Power BI has three visuals for this:
| Visual | What it shows | Use it for |
|---|---|---|
| Card | One or more big numbers | The totals readers look at first |
| KPI | A number, a target and a small trend chart | Answering "are we ahead of the target or behind it?" |
| Gauge | One number on a half circle, with a target line | Progress toward a single goal |
In the First Report chapter you made a card with one number.
This chapter goes further: several measures in one card, a comparison with last year, and a KPI with a target.
The examples use your file from the DAX chapter, for example poke_mart_dax.pbix (see Power BI Visuals for what it holds), with the measures Total Sales, Profit, Margin %, Order Count, Sales LY and Sales YoY %.
The measures are formatted as Whole Number with a thousands separator, and the percentage measures as Percentage with 2 decimals.
A Card With Several Measures
One card visual can show several values.
Each value gets its own small card inside the visual.
- Click an empty spot on the canvas, so no visual is selected.
- In the Visualizations pane, on the Build visual tab, select Card.
- From the Sales table in the Data pane, drag Total Sales, Profit, Margin % and Order Count to the Value well, in that order.
The visual now holds four cards, side by side.
Cards shorten big numbers, and there is no setting to show the full number on a card.
The four cards read 9M, 4M, 45.58% and 3K. The exact values are:
| Card | Expected value |
|---|---|
| Total Sales | 9,416,800 |
| Profit | 4,292,195 |
| Margin % | 45.58% |
| Order Count | 2,740 |
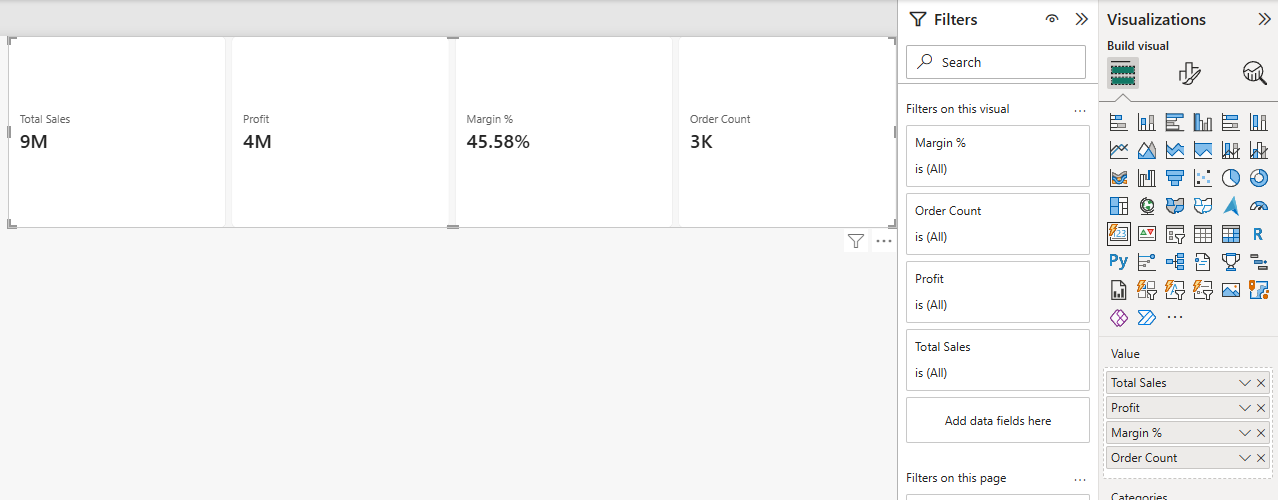
One visual with four values is better than four separate card visuals.
It is easier to keep aligned, and it loads faster, because Power BI needs fewer queries to fill it.
Note: The card visual was redesigned in November 2025. Older reports can still contain the legacy single card and multi-row card visuals.
They keep working, but when you select Card today, you get the new card visual described here.
Compare With Last Year: Reference Labels
A big number alone does not tell you if it is good or bad.
A reference label adds a smaller number to a card, for example last year's sales.
A comparison with last year only makes sense for one year at a time.
So first, filter the card to 2025:
- Select the card.
- In the Data pane, drag Year from the Date table to the Filters pane, into Add data fields here under Filters on this visual.
- The new Year filter opens as Advanced filtering. Set Filter type to Basic filtering, and select 2025.
The four cards now show 2025 only.
They read 5M, 2M, 45.64% and 1K:
| Card (2025) | Expected value |
|---|---|
| Total Sales | 5,023,600 |
| Profit | 2,292,625 |
| Margin % | 45.64% |
| Order Count | 1,464 |
Now add last year's sales to the Total Sales card:
- With the card selected, select Format visual, and on the Visual tab expand Reference labels.
- Under Apply settings to, set Cards to Total Sales, so the label goes on that card only.
- Select +Add data. A Data list opens, with a search box. Pick Sales LY. You can also drag Sales LY onto the button. The label appears below the Total Sales number.
- A Select label box now appears in the Apply settings to section, below Cards and Add label. Change it from All to Sales LY. The Detail settings accept a field only when one label is selected here.
- Expand Detail and turn it On. Drag Sales YoY % to its Data box.
The Total Sales card now shows last year's sales and the growth below the big number: 5M, then Sales LY 4M and 14.35%. The exact values are:
| Part of the card | Measure | Expected value |
|---|---|---|
| Callout value | Total Sales | 5,023,600 |
| Reference label | Sales LY | 4,393,200 |
| Detail | Sales YoY % | 14.35% |
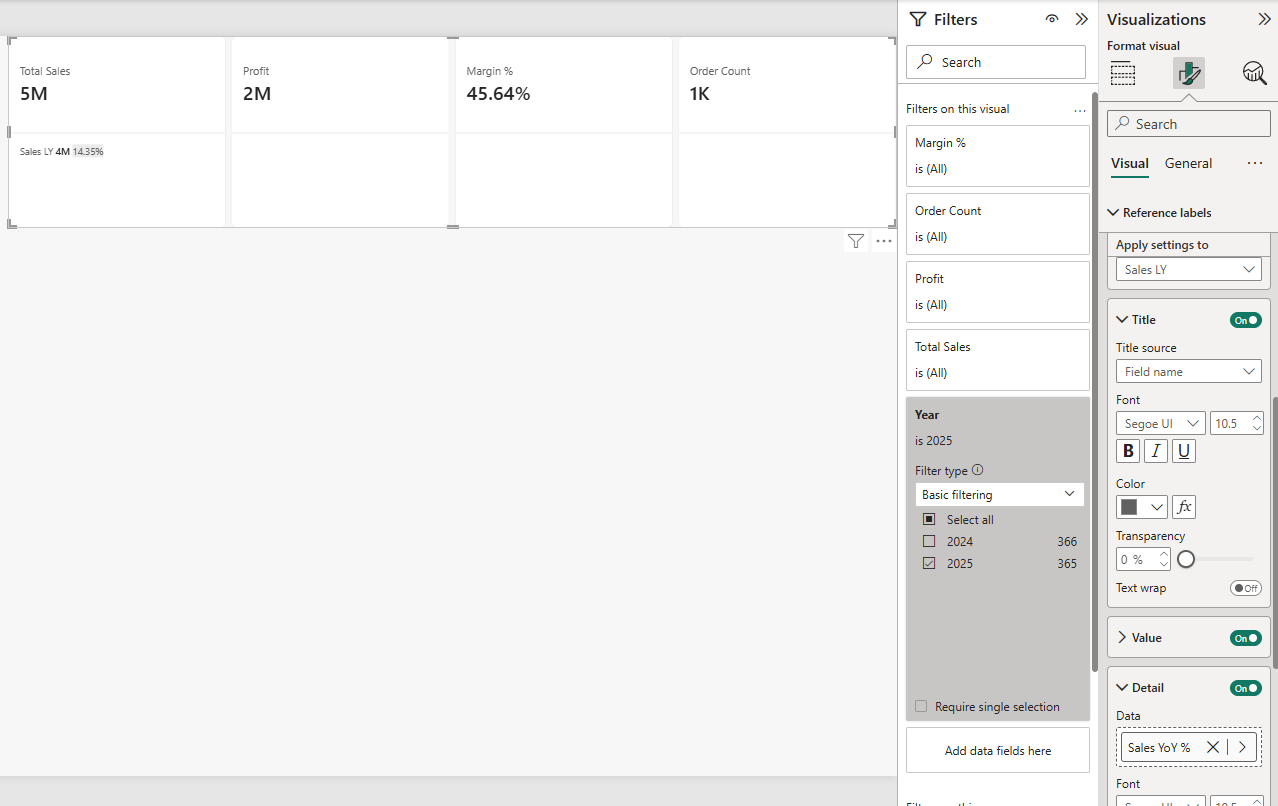
Check the math: 5,023,600 - 4,393,200 = 630,400 more than last year, and 630,400 / 4,393,200 = 14.35%.
Sales LY and Sales YoY % are the measures from DAX Time Intelligence:
Example
Sales LY = CALCULATE([Total Sales], SAMEPERIODLASTYEAR('Date'[Date]))
Example
Sales YoY % = DIVIDE([Total Sales] - [Sales LY], [Sales LY])
Note: Without the Year filter, the card compares two years with one.
Total Sales is then 9,416,800 (2024 and 2025), but Sales LY is 4,393,200 (only 2024, since there are no sales in 2023).
Sales YoY % would show 114.35%, which is not a real growth rate.
The KPI Visual
A KPI (Key Performance Indicator) visual answers one question: are we ahead of the target or behind it?
It uses three wells:
- Value: the measure you track. Here, Total Sales.
- Trend axis: a time column. It is drawn as a small chart behind the number. Here, Month.
- Target: the goal. Here, Sales LY, so the goal is to beat last year.
Build the KPI like this:
- Click an empty spot on the canvas and select KPI in the Visualizations pane.
- Drag Total Sales to the Value well, and Month from the Date table to the Trend axis well. Month is sorted by Month Number, so the trend runs from Jan to Dec by itself.
- Drag Sales LY to the Target well.
- Drag Year to Filters on this visual. Set Filter type to Basic filtering, and select 2025.
The Year filter is needed because Month holds only the month name.
Without it, "Jan" would add up January 2024 and January 2025.
These are the numbers behind the KPI, month by month:
| Month (2025) | Total Sales | Sales LY | Above target |
|---|---|---|---|
| Jan | 317,300 | 290,600 | 9.19% |
| Feb | 289,900 | 226,000 | 28.27% |
| Mar | 370,750 | 336,350 | 10.23% |
| Apr | 359,450 | 301,300 | 19.30% |
| May | 414,500 | 378,600 | 9.48% |
| Jun | 423,850 | 439,500 | -3.56% |
| Jul | 510,200 | 473,500 | 7.75% |
| Aug | 585,600 | 472,700 | 23.88% |
| Sep | 356,300 | 277,400 | 28.44% |
| Oct | 363,250 | 339,650 | 6.95% |
| Nov | 398,500 | 341,050 | 16.85% |
| Dec | 634,000 | 516,550 | 22.74% |
June is the only month that sold less than the same month last year.
Here is the thing that surprises most people: the KPI does not show the year total.
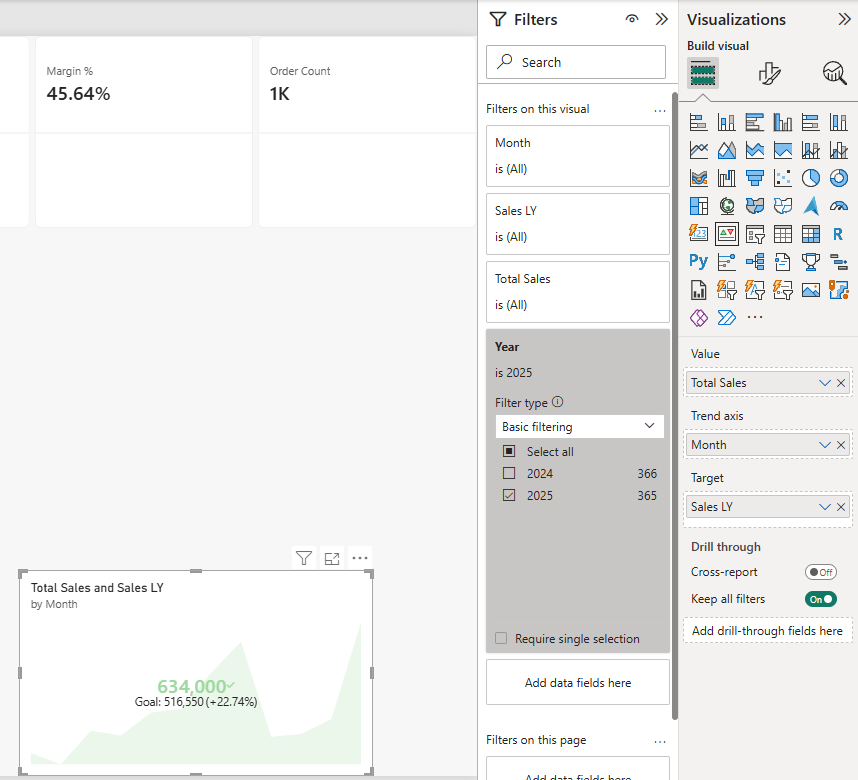
The big number is the value of the last point on the trend axis, which is December:
| KPI part | Expected value |
|---|---|
| Value (December 2025) | 634,000 |
| Target (December 2024) | 516,550 |
| Distance to the target | +22.74% |
The distance is (634,000 - 516,550) / 516,550 = 22.74%.
The Target label below the number shows the target and this distance: "Goal: 516,550 (+22.74%)".
The value beats the target, so the KPI shows it in green, with a check mark.
Power BI knows that more sales is good because Format visual > Visual > Trend axis > Direction is set to High is good.
For a measure where lower is better, such as costs, change the direction.
To compare whole years instead, put Year in the Trend axis well and remove the 2025 filter.
The last point is then the year 2025:
| Trend axis | Last point | Value | Target | Distance |
|---|---|---|---|---|
| Month (filtered to 2025) | Dec | 634,000 | 516,550 | +22.74% |
| Year (no filter) | 2025 | 5,023,600 | 4,393,200 | +14.35% |
The Gauge Visual
A Gauge shows one value as a filled arc on a half circle.
Drag Total Sales to the Value well and Sales LY to the Target value well, and filter the gauge to 2025, like the card.
The arc then fills up to 5,023,600, and a needle marks the target at 4,393,200. The arc starts at 0, and unless you set a Maximum value, it ends at double the value, 10,047,200. You can set your own range in Format visual > Gauge axis.
| Gauge part (2025) | Expected value |
|---|---|
| Value (Total Sales) | 5,023,600 |
| Target value (Sales LY) | 4,393,200 |
| Start of the arc | 0 |
| End of the arc (double the value) | 10,047,200 |
A gauge takes more space than a card and shows less.
Use it when the progress toward one goal is the whole message.







