
Power BI Interface
The Power BI Desktop Window
This is Power BI Desktop with the Poke Mart data loaded and one chart on the page:
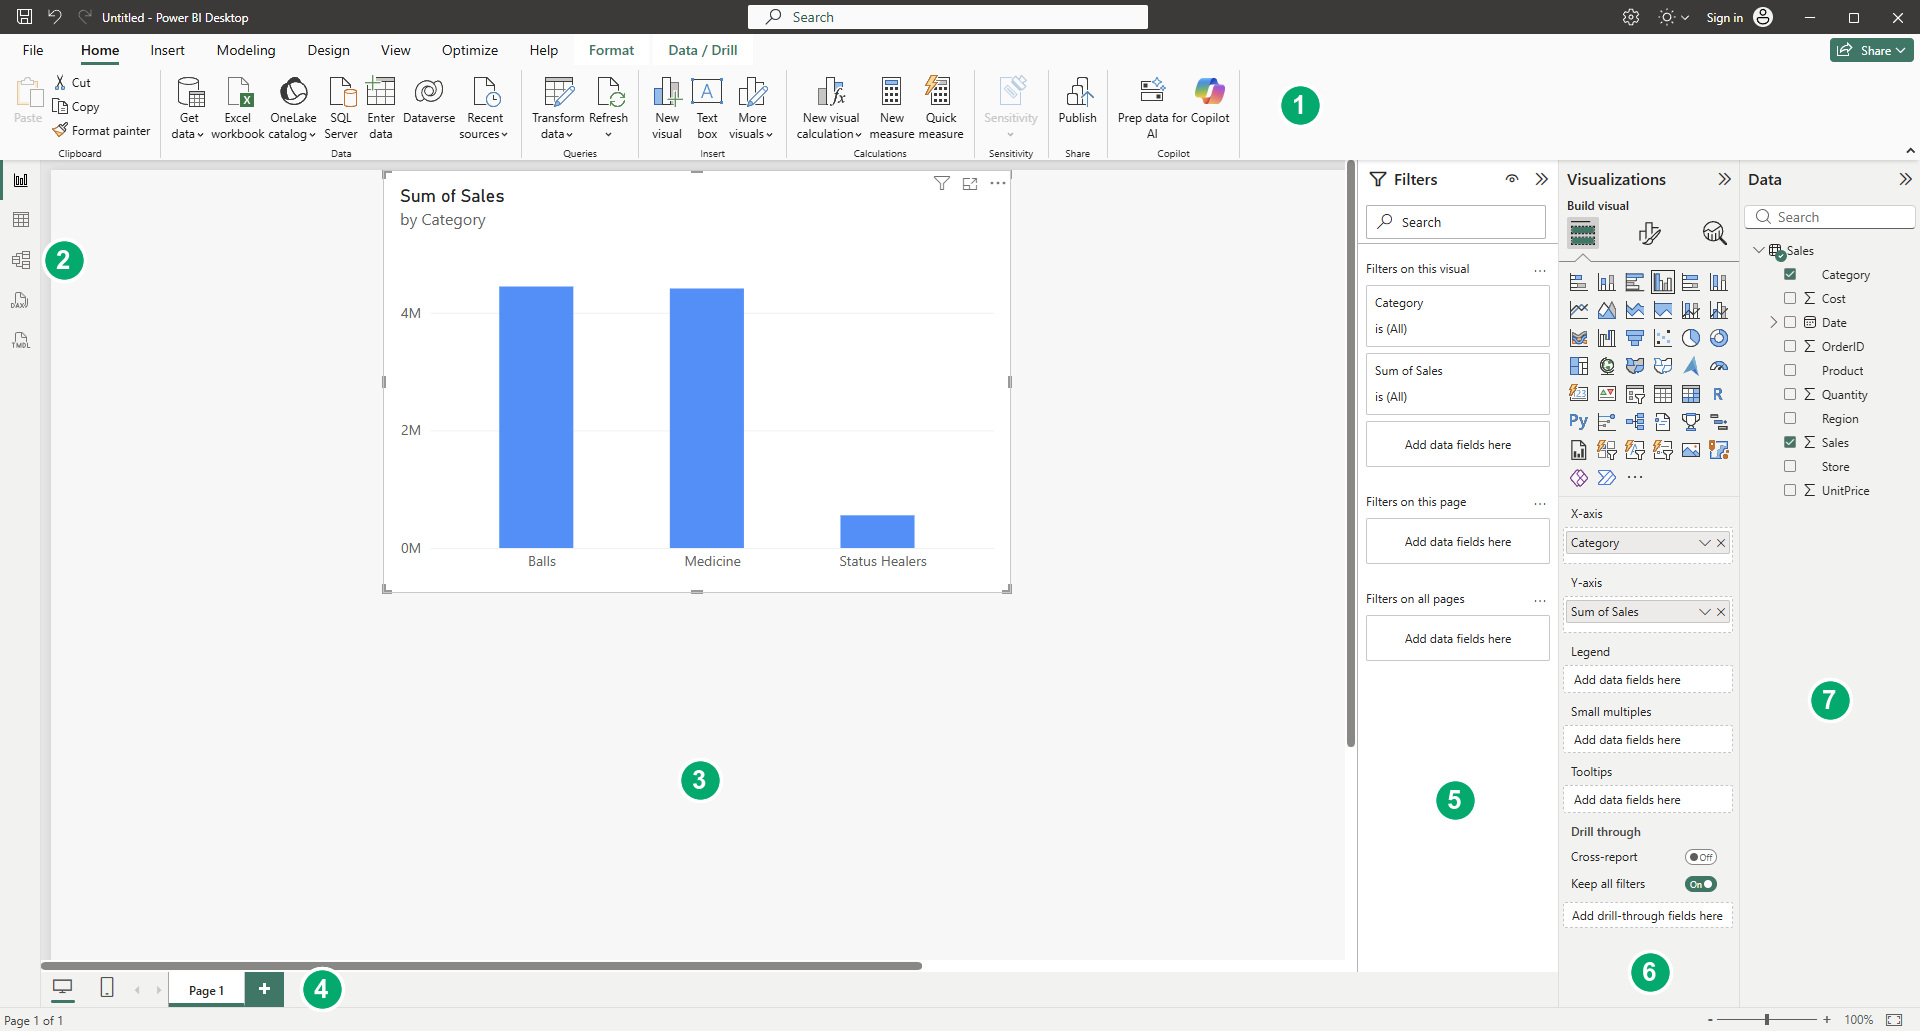
The window has these main parts:
- Ribbon: tabs with buttons for getting data, adding visuals, modeling and more.
- View buttons: icons on the left side that switch between the views of your file.
- Report canvas: the large area in the middle where you place visuals.
- Page tabs: one tab for each page of the report, at the bottom.
- Filters pane: filters for the selected visual, the current page, or all pages.
- Visualizations pane: choose a visual type, and set which fields it uses and how it looks.
- Data pane: the tables and fields (columns) in your data.
Do not try to learn every button now.
You will use each part in the chapters to come.
The Views
The icons on the left side of the window switch between five views.
Each view shows a different side of the same file:
| View | What you do there |
|---|---|
| Report view | Build report pages with visuals. Power BI Desktop opens in this view. |
| Table view | See the rows and columns of the data you loaded. |
| Model view | See all tables and the relationships between them. |
| DAX query view | Write DAX queries that return data from the model. |
| TMDL View | Edit the model as code, for advanced users. |
As a beginner, you will mostly use Report view, Table view and Model view.
Table view was called Data view in older versions of Power BI Desktop.
You may still see that name in older guides.
The Ribbon
The ribbon works like the ribbon in Excel.
Each tab groups related commands:
| Tab | What you find there |
|---|---|
| Home | Get data, Transform data, Refresh and Publish |
| Insert | New pages, visuals, text boxes and buttons |
| Modeling | New measures and columns, relationships, data types |
| Design | The look of the report pages, such as themes |
| View | Buttons to show or hide panes, and how the page is shown |
| Optimize | Tools to find out why a report is slow |
| Help | Help links, and About, which shows your version number |
This is the Home tab.
You will use Get data on the left in almost every project:

Some tabs appear only when you need them.
For example, when you select a visual, the Format and Data / Drill tabs appear, as in the first picture on this page.
When you select a column in the Data pane, a Column tools tab appears.
The ribbon also has a search box at the top.
Type what you want to do, for example "new page", to find the right button.
The Report Canvas and Pages
The report canvas is where you build your report.
You add visuals to it, then move and resize them like shapes in Excel.
A report can have many pages.
The page tabs at the bottom of the canvas show them:
- Select a tab to open that page.
- Select the + next to the tabs to add a new page.
- Right-click a tab to rename, duplicate or hide the page.
A new report starts with one empty page, called Page 1.
The Panes
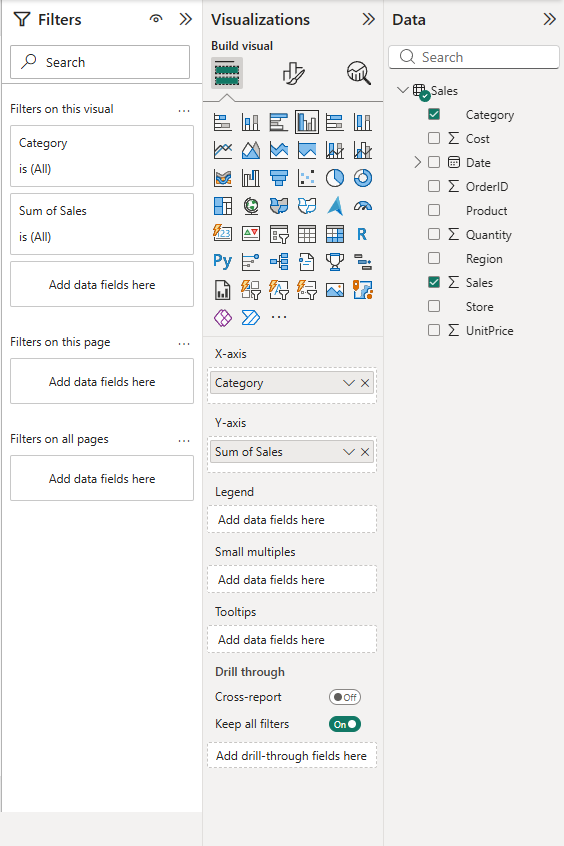
When you work in Report view, three panes sit to the right of the canvas: Filters, Visualizations and Data.
Data Pane
The Data pane lists the tables in your data.
Expand a table to see its fields (columns).
Select the check box next to a field to add it to the selected visual, or drag the field onto the canvas.
Small icons show what kind of field it is:
- A sigma sign (Σ) marks a number field that Power BI summarizes automatically, for example by adding it up.
- A calendar icon marks a date field. It opens into a date hierarchy: Year, Quarter, Month and Day.
- A calculator icon marks a measure, a calculation you write yourself with DAX.
Older versions and guides call this pane the Fields pane.
Visualizations Pane
The Visualizations pane has three parts.
Switch between them with the icons at the top of the pane:
- Build visual: a gallery of visual types, such as column charts, line charts, pie charts, cards, tables, maps and slicers. Select one to add it to the canvas, or to change the type of the selected visual. Below the gallery are the field wells, the boxes that decide how each field is used. A column chart has wells such as X-axis, Y-axis and Legend. The wells change with the visual type.
- Format visual (the brush icon): colors, titles, labels, fonts and other formatting.
- Analytics (the magnifying glass icon): extra lines, such as an average line or a trend line.
Filters Pane
The Filters pane shows the filters for the selected visual, for the current page, and for all pages of the report.
Power BI adds every field you use in a visual to the Filters pane automatically.
You can also drag other fields into it.
Filters in the Filters pane are saved with the report.
Later you will also learn about slicers, which are filters placed right on the canvas.
Note: If the Filters pane is missing, open the View tab and select Filters under Show panes.
A pane that you collapsed with the double arrow at its top right shrinks to a narrow strip; select the strip to open the pane again.
If the Visualizations pane is gone and the build and format buttons appear on the visual itself, the preview feature On-object interaction is turned on.
This tutorial uses the default layout.
To turn the preview off, go to File > Options and settings > Options > Preview features, clear On-object interaction, and restart Power BI Desktop.
Power Query Editor
One important part of Power BI Desktop is not in the main window.
When you select Transform data on the Home tab, the Power Query Editor opens in its own window.
There you clean and shape data before it is loaded into the report.
You will learn Power Query in a later chapter.







