
Power BI Power Query Filter Rows
Remove the Rows You Do Not Want
The Poke Mart file has two kinds of rows that do not belong in a sales report:
- 3 test rows, made by someone testing the till, with the product TEST ITEM
- 6 duplicate rows, orders that were exported twice
In this chapter you filter out the test rows and remove the duplicates.
The query goes from 1,285 rows to 1,276.
This page continues the cleanup from Power Query Data Types.
Open pq_cleanup.pbix, the report you saved there, select Home > Transform data, and select the last step of the poke_mart_raw_2024 query, Changed Type1.
Count the Rows
Before you remove rows, find out how many there are.
The left side of the status bar, at the bottom of the Power Query Editor, shows the number of columns and rows.
For the Poke Mart query it shows 7 COLUMNS, 999+ ROWS, not 1,285 rows.
That is because the data preview holds only the top rows of the query, and the status bar counts the preview.
It always says 999+ for a query this size, even after the change below.
The column profile can count every row, but by default it also looks only at the top 1000 rows. Change that first:
- In the status bar, select Column profiling based on top 1000 rows.
- Select Column profiling based on entire data set.
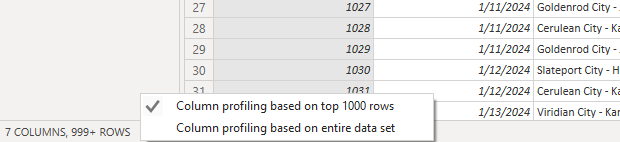
The status bar still says 999+ ROWS, but the profiles now look at all the rows. To read the count:
- On the View tab, select the Column profile check box.
- Select the OrderID column.
- In the pane below the preview, Column statistics shows a Count of 1,285.
Note: The setting changes Column quality, Column distribution and Column profile.
By default they look only at the top 1000 rows.
A column can look 100% valid in the profile and still have an error in row 1,200. For a small file like this one, profiling the entire data set is quick.
For a table with millions of rows, it can make the editor slow.
Each time you open the Power Query Editor, the setting goes back to the top 1000 rows.
Another way to count is Transform > Count Rows.
It replaces the table with a single number, so delete that step again when you have read it.
Find the Test Rows
The test rows are far down the file, so you do not see them at the top of the preview.
Select the arrow in the Product header.
The list of values is built from the top rows only, so Power Query warns: List may be incomplete. Type TEST ITEM in the search box above the list to find it.
The list also shows how messy the product names are, but you fix those later.
These are the three test rows:
| 123OrderID | DATEOrderDate | ABCLocation | ABCProduct | 123Quantity | 123UnitPrice | 123Sales |
|---|---|---|---|---|---|---|
| 9001 | 5/18/2024 | Viridian City - Kanto | TEST ITEM | 0 | 0 | 0 |
| 9002 | 7/26/2024 | Viridian City - Kanto | TEST ITEM | 0 | 0 | 0 |
| 9003 | 12/4/2024 | Viridian City - Kanto | TEST ITEM | 0 | 0 | 0 |
They sell nothing, so they do not change the sales total.
But they would count as orders, and TEST ITEM would show up as a product in your charts.
Filter Out the Test Rows
Two different filters remove exactly these three rows:
- Product does not equal TEST ITEM
- Quantity is greater than 0
This tutorial uses the filter on Quantity, for two reasons:
- It says what a real order is: an order that sells at least one item.
- It does not depend on how the test product is spelled. The Product column is still messy at this point, and text filters in Power Query are case-sensitive: a test row typed as "test item" would get through the Product filter.
- Select the arrow in the Quantity header.
- Select Number Filters > Greater Than....
- The Filter Rows dialog opens. Under Keep rows where 'Quantity', is greater than is already selected. Type 0 in the box next to it.
- Select OK.
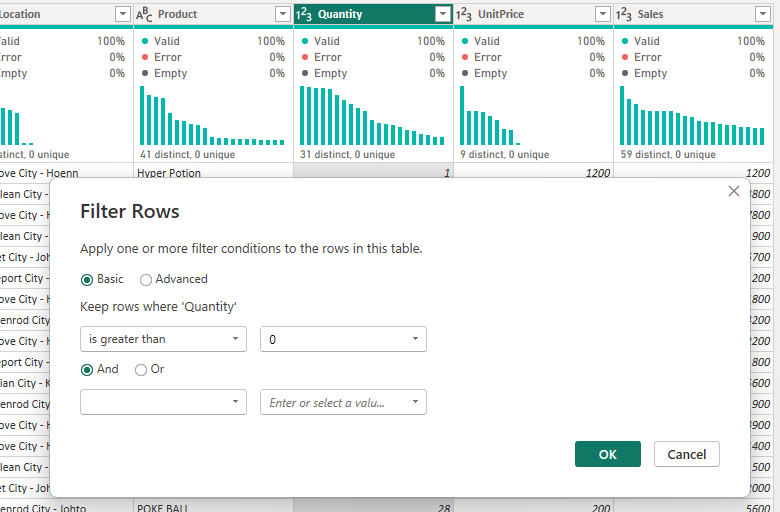
Power Query adds a step called Filtered Rows, and a small filter icon appears in the Quantity header.
The Count in Column statistics is now 1,282.
The formula bar shows something similar to this:
= Table.SelectRows(#"Changed Type1", each [Quantity] > 0)
In words: from the table of the step Changed Type1, keep the rows where each row's Quantity is greater than 0.
The Advanced option of the Filter Rows dialog lets you combine rules on several columns, with and or or.
The Other Way: Clear a Check Box
For the filter on Product, you would select the arrow in the Product header, find TEST ITEM with the search box, clear its check box, and select OK.
The formula would be similar to this:
= Table.SelectRows(#"Changed Type1", each ([Product] <> "TEST ITEM"))
Clearing check boxes is the quickest way to filter out a few known values.
Only use one of the two filters in your query.
When the check box list may not show every value, Power Query says List may be incomplete. and offers Load more.
The search box looks through all the values.
Remove Duplicates
A duplicate row is a row where every column has the same value as in another row.
Order 1199 is one of them:
| 123OrderID | DATEOrderDate | ABCLocation | ABCProduct | 123Quantity | 123UnitPrice | 123Sales |
|---|---|---|---|---|---|---|
| ... | ... | ... | ... | ... | ... | ... |
| 1198 | 3/16/2024 | Violet City - Johto | Great Ball | 11 | 600 | 6600 |
| 1199 | 3/16/2024 | Lilycove City - Hoenn | Poke Ball | 30 | 200 | 6000 |
| 1199 | 3/16/2024 | Lilycove City - Hoenn | Poke Ball | 30 | 200 | 6000 |
| 1200 | 3/16/2024 | Goldenrod City - Johto | Awakening | 5 | 250 | 1250 |
| ... | ... | ... | ... | ... | ... | ... |
If you keep both rows, order 1199 is counted twice, and its 6000 in sales too.
Spot Duplicates with Column Distribution
Every order should have its own OrderID.
Column profiling can check that for you.
Turn on View > Column distribution and look under the OrderID header:
- Based on the entire data set, OrderID has 1,276 distinct values in 1,282 rows, and 1,270 unique values. So 6 order IDs appear twice.
- Based on the top 1000 rows (the default), it says 994 distinct and 988 unique. Those numbers are about the first 1000 rows only.
Distinct counts the different values.
Unique counts the values that appear only once.
Remove the Duplicate Rows
- Select all the columns: select the OrderID header, hold Shift, and select the Sales header. You can also click a header and press Ctrl+A.
- On the Home tab, select Remove Rows > Remove Duplicates.
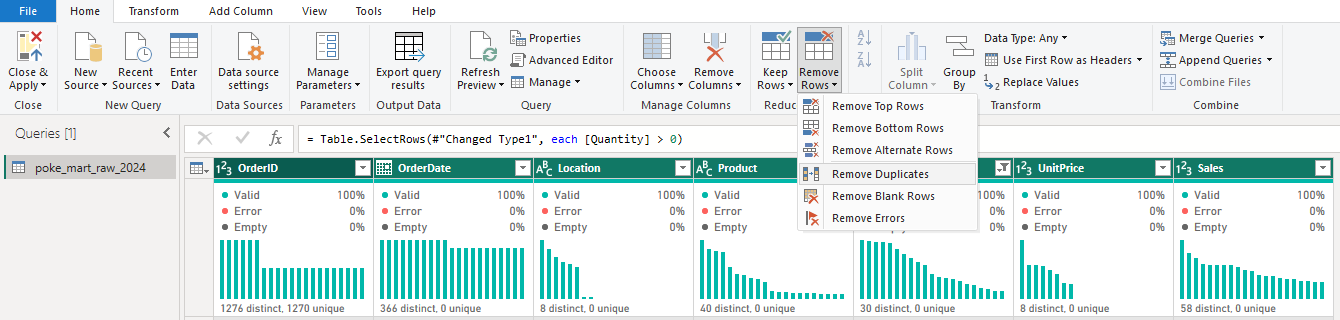
There is no dialog.
Power Query adds a step called Removed Duplicates, and the query has 1,276 rows.
Under OrderID, Column distribution now says 1276 distinct, 1276 unique: every order appears once.
The formula is similar to this:
= Table.Distinct(#"Filtered Rows")
Note: Remove Duplicates only compares the selected columns.
If you select only OrderID, Power Query keeps one row for each OrderID, even when the other columns differ.
In this file that gives the same result, because every repeated order is an exact copy.
With all columns selected, only rows that match completely are removed.
Remove Duplicates is also case-sensitive: "Poke Ball" and "poke ball" are different values to Power Query.
To look at the duplicates before you remove them, use Home > Keep Rows > Keep Duplicates, then delete that step again.
Excel has a Remove Duplicates command too: see How to Remove Duplicates with Excel.
Keep or Remove Top Rows
Home > Keep Rows > Keep Top Rows and Home > Remove Rows > Remove Top Rows keep or remove a fixed number of rows from the top, which is handy for exports with title lines above the headers.
Where You Are Now
| After the step | Rows |
|---|---|
| Changed Type1 | 1,285 |
| Filtered Rows | 1,282 |
| Removed Duplicates | 1,276 |
The query has 1,276 rows and the same seven columns.
Its Applied Steps are: Source, Promoted Headers, Changed Type, Removed Columns, Renamed Columns, Added Custom, Changed Type1, Filtered Rows and Removed Duplicates.
Select any step, and the Count in Column statistics shows how many rows the query had at that point.
This is a good way to check your work.
Select Close & Apply, then File > Save to save pq_cleanup.pbix.
In the next chapter you split the Location column into a store and a region.







