
Power BI Bar and Column Charts
Bar or Column?
Bar and column charts compare values across categories.
The length of each bar or column shows its value.
- A column chart has vertical columns. It works well for a few categories, and for time periods, which read naturally from left to right.
- A bar chart has horizontal bars. It works well when there are many categories or when the category names are long, because the names have room on the left.
Power BI has three kinds of each:
| Kind | Column chart | Bar chart |
|---|---|---|
| Clustered | Clustered column chart | Clustered bar chart |
| Stacked | Stacked column chart | Stacked bar chart |
| 100% stacked | 100% Stacked column chart | 100% Stacked bar chart |
In a column chart, categories go in the X-axis well and values in the Y-axis well.
In a bar chart it is the other way around: categories go in the Y-axis well and values in the X-axis well.
If you have made charts in Excel, you already know these types.
See Excel Bar Charts and Excel Column Charts.
This page uses your file from the DAX chapter, for example poke_mart_dax.pbix (see Power BI Visuals for what it holds), with the measure Total Sales.
Clustered Column Chart with a Legend
A Legend splits each column by a second category.
Let's show Total Sales by Region, split by product category:
- Click an empty spot on the canvas.
- In the Visualizations pane, select Clustered column chart.
- In the Data pane, select Stores > Region and Sales > Total Sales.
- Drag Products > Category to the Legend well.
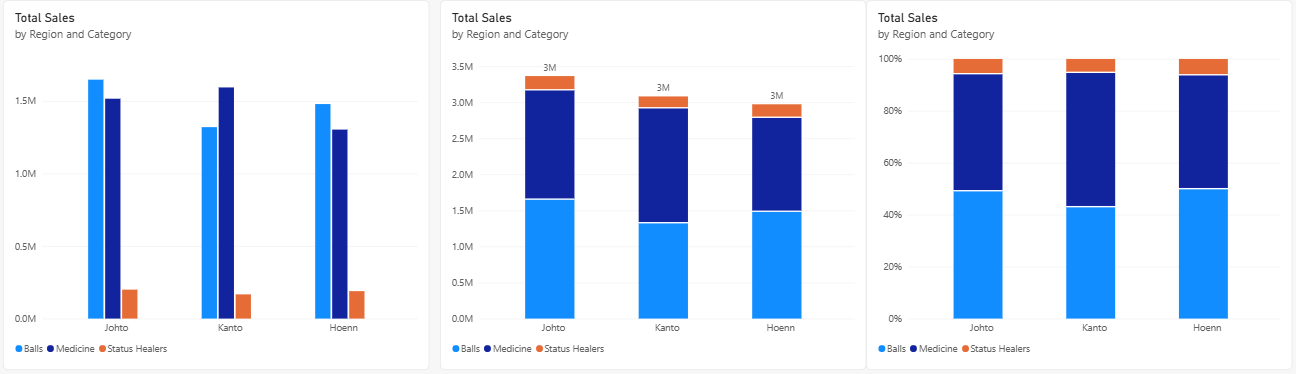
Each region now has three columns side by side, one for each category, in the colors shown in the legend.
Point to a column to see its value:
| Region | Balls | Medicine | Status Healers | Region total |
|---|---|---|---|---|
| Hoenn | 1,479,400 | 1,303,300 | 189,300 | 2,972,000 |
| Johto | 1,647,600 | 1,516,300 | 199,750 | 3,363,650 |
| Kanto | 1,320,200 | 1,594,000 | 166,950 | 3,081,150 |
Clustered columns make it easy to compare the categories inside each region.
In Hoenn and Johto, Balls sell the most.
In Kanto, Medicine sells the most.
The region totals are not drawn in a clustered chart.
For those, stack the columns.
Note: A Legend works with one measure only.
If the Y-axis well holds two or more measures, you cannot add a field to the Legend.
Stacked Column Chart
- With the chart selected, select Stacked column chart in the Visualizations pane.
The three columns of each region are now stacked into one.
The pieces show the same values as before, and the height of each full column is the region total: 2,972,000 for Hoenn, 3,363,650 for Johto and 3,081,150 for Kanto.
To write each total above its column, select Format visual, open the Visual tab, and turn on Total labels.
The labels are shortened, so all three read 3M.
A stacked chart shows the totals and the bottom piece clearly.
The upper pieces are harder to compare, because they do not start from the same baseline.
100% Stacked Column Chart
- With the chart selected, select 100% Stacked column chart.
Now every column has the same height, 100%.
Each piece shows the category's share of that region's sales.
You do not need a percentage measure: the chart calculates the shares from Total Sales.
| Region | Balls | Medicine | Status Healers |
|---|---|---|---|
| Hoenn | 49.78% | 43.85% | 6.37% |
| Johto | 48.98% | 45.08% | 5.94% |
| Kanto | 42.85% | 51.73% | 5.42% |
This chart answers a different question: not "how much?" but "what is the mix?".
Kanto is the only region where Medicine is more than half of sales.
Here are the three versions side by side:
| Chart | Best for |
|---|---|
| Clustered | Comparing categories inside each group |
| Stacked | Comparing group totals, and seeing what they are made of |
| 100% stacked | Comparing the mix (the shares) between groups of different sizes |
Sort by Value
A bar chart is the best choice for the ten products, because their names are long.
Sort the bars so the biggest seller is on top:
- Click an empty spot on the canvas.
- In the Visualizations pane, select Clustered bar chart.
- In the Data pane, select Products > Product and Sales > Total Sales. Product goes to the Y-axis well and Total Sales to the X-axis well.
- Power BI sorts the bars by Total Sales, largest first, by default. To check it, select More options (...) in the corner of the visual and point to Sort by. Total Sales and Sort descending have check marks.
- If they do not, select Sort by > Total Sales. Then select More options (...) > Sort by again, and select Sort descending.
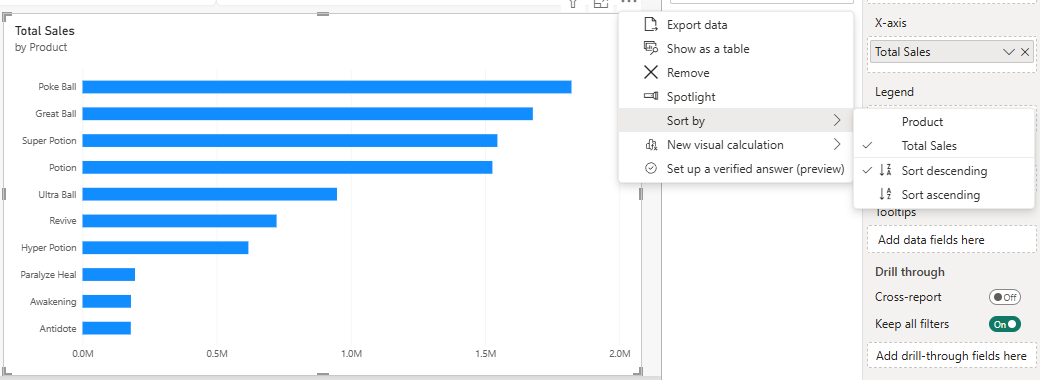
The bars are now in this order, from top to bottom:
| Product | Total Sales |
|---|---|
| Poke Ball | 1,821,600 |
| Great Ball | 1,677,600 |
| Super Potion | 1,545,600 |
| Potion | 1,527,000 |
| Ultra Ball | 948,000 |
| Revive | 723,000 |
| Hyper Potion | 618,000 |
| Paralyze Heal | 195,600 |
| Awakening | 180,500 |
| Antidote | 179,900 |
Sorted, the chart reads like a ranking.
Poke Ball is the top seller, even though it is the cheapest ball (200 each), because the shop sold 9,108 of them.
To sort by name instead, select Sort by > Product, then Sort by > Sort ascending for A to Z.
Data Labels
Data labels write each value on its bar, so readers do not have to guess from the axis:
- Select the bar chart.
- In the Visualizations pane, select Format visual and open the Visual tab.
- Turn on Data labels.
Each bar now shows its value.
Power BI shortens large numbers in the labels, for example to 1.82M.
To show the full numbers, expand Data labels > Value and set Display units to None.
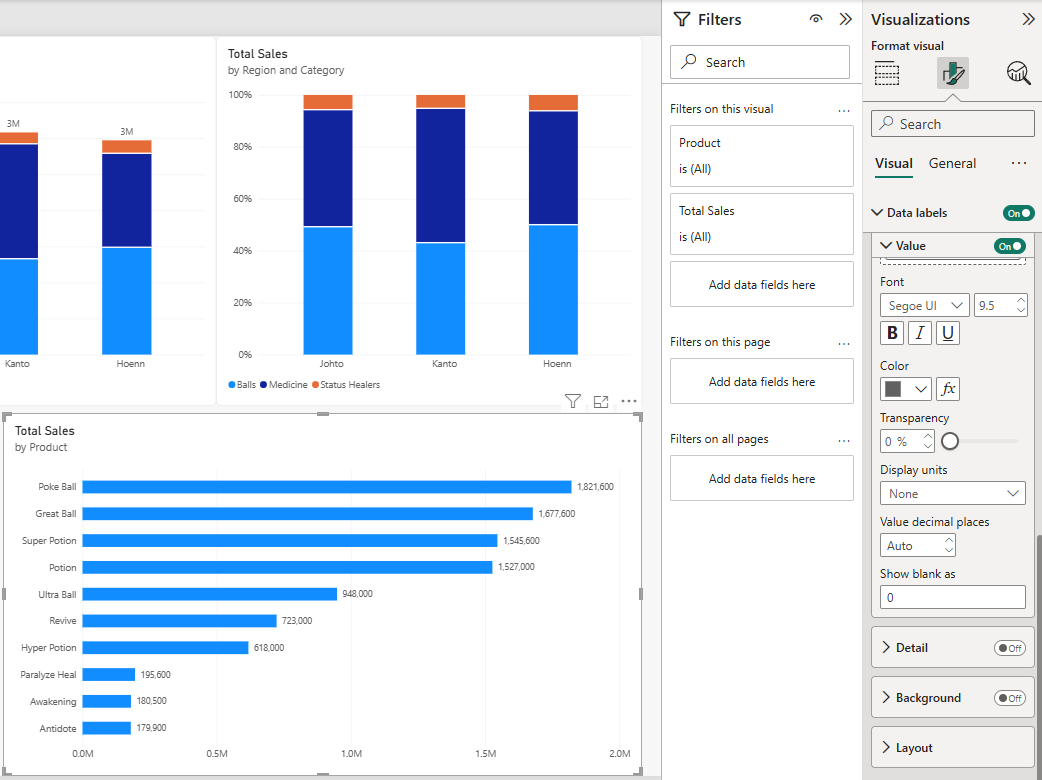
With data labels on, the value axis is no longer needed.
You can turn off X-axis on the Visual tab for a cleaner chart.
Good job! You can now build all six bar and column charts, sort them and label them.







