
Power BI Introduction
What is Power BI?
Power BI is a business analytics tool from Microsoft.
BI stands for business intelligence: turning raw data into information that helps people make decisions.
With Power BI you connect to data, clean it, and turn it into interactive reports with charts, tables, cards and maps.
The reports are interactive.
When a reader clicks a bar in a chart or picks a value in a filter, every visual on the page updates.
Power BI is typically used for:
- Sales and finance reports
- Dashboards that track key numbers (KPIs)
- Combining data from many sources in one place
- Sharing reports that stay up to date when the data changes
The Parts of Power BI
Power BI is not one single program.
It is a set of tools that work together:
- Power BI Desktop is a free Windows application. You use it to connect to data, clean and model it, and design reports. This tutorial uses Power BI Desktop.
- Power BI service is the online part. It runs in a web browser at
app.powerbi.com. You publish reports there, share them with others, and build dashboards. - Power BI Mobile apps for iOS and Android let you view and interact with reports and dashboards on a phone or tablet.
A typical project starts in Power BI Desktop and ends in the Power BI service, where other people read the report.
The Power BI service is part of Microsoft Fabric, a larger Microsoft platform for data and analytics.
You may see the Fabric name when you sign in.
For this tutorial, you only need the Power BI parts.
What You Can Build
These are the main things you create in Power BI:
- Report: one or more pages of interactive visuals, such as charts, tables and cards. You usually build reports in Power BI Desktop.
- Dashboard: a single page of tiles pinned from one or more reports, used to watch the most important numbers. Dashboards are made in the Power BI service.
- Semantic model: the data behind a report, together with its relationships and calculations. Older versions of Power BI called it a dataset.
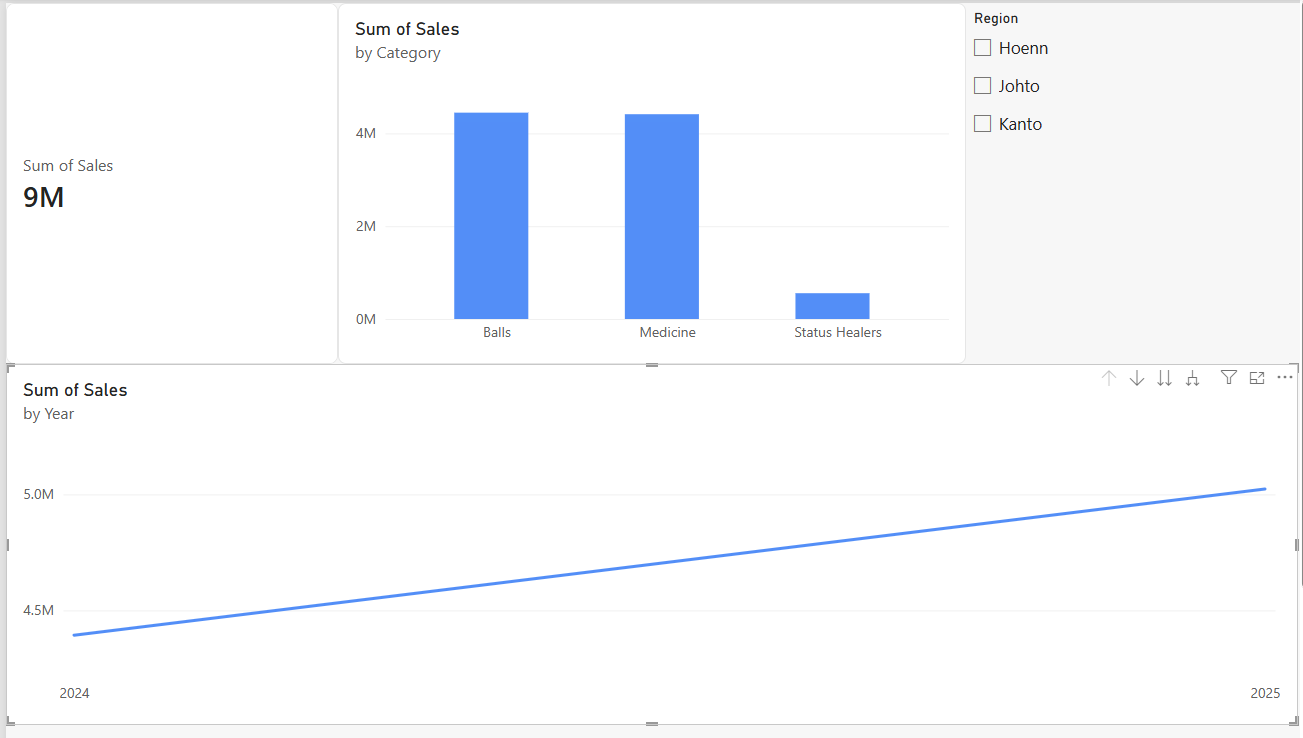
This is the report you will build in the First Report chapter:
Power BI vs Excel
If you know Excel, you already know a lot of Power BI.
Both programs come from Microsoft, and they share two important tools: Power Query, for getting and cleaning data, and the same data model engine, which Excel calls Power Pivot.
They are good at different things:
| Excel | Power BI | |
|---|---|---|
| Best for | Calculations, what-if analysis and quick, one-off analysis | Interactive reports that many people read |
| Data | Usually one workbook, up to 1,048,576 rows per sheet | Large amounts of data, often from many sources |
| Formulas | Cell formulas, like =SUM(B2:B10) |
DAX measures that work on whole columns |
| Interaction | Filters, slicers and PivotTables | Every visual on a page filters the others |
| Sharing | Send or share the workbook file | Publish to the Power BI service and share a link |
Many people use both.
They explore data in Excel, and build the report that the whole team reads in Power BI.
If you have used an Excel PivotTable, you will feel at home.
A Power BI visual works much like a PivotTable: you pick a category and a number, and Power BI adds up the number for each category.
Read our Excel PivotTable Intro for a refresher.
Get Started
This tutorial teaches the basics of Power BI Desktop, step by step.
It helps to know some Excel, but you do not need any programming experience.
Get Started »






