
Power BI DAX Calculated Columns
What is a Calculated Column?
A calculated column is a new column that you add to a table with a DAX formula.
You write the formula once.
Power BI calculates it for every row of the table and stores the results in the model, just like the columns you loaded.
Use a calculated column when you need a value for each row: to show it in a table, to group by it, or to use it in a slicer or filter.
This page uses the Poke Mart model described in DAX Introduction.
Row Context: One Row at a Time
A calculated column is calculated one row at a time.
For each row, the formula sees the values in that row.
This is called row context: it simply means "the current row".
In the formula below, Products[UnitPrice] means the unit price in the current row, not the whole column:
Example
Margin per Unit = Products[UnitPrice] - Products[UnitCost]
For the Poke Ball row, the formula calculates 200 - 110 = 90. For the Great Ball row, it calculates 600 - 330 = 270. And so on, for all 10 products.
This works like an Excel formula copied down a column, where each row uses the cells in its own row.
Create a Calculated Column
Add the Margin per Unit column to the Products table:
- Select Table view on the left side of Power BI Desktop.
- In the Data pane, select the Products table.
- On the Table tools tab, select New column. You can also right-click Products in the Data pane and select New column.
- The formula bar opens with the text Column = . Replace the whole text with the formula below.
- Press Enter.
Example
Margin per Unit = Products[UnitPrice] - Products[UnitCost]
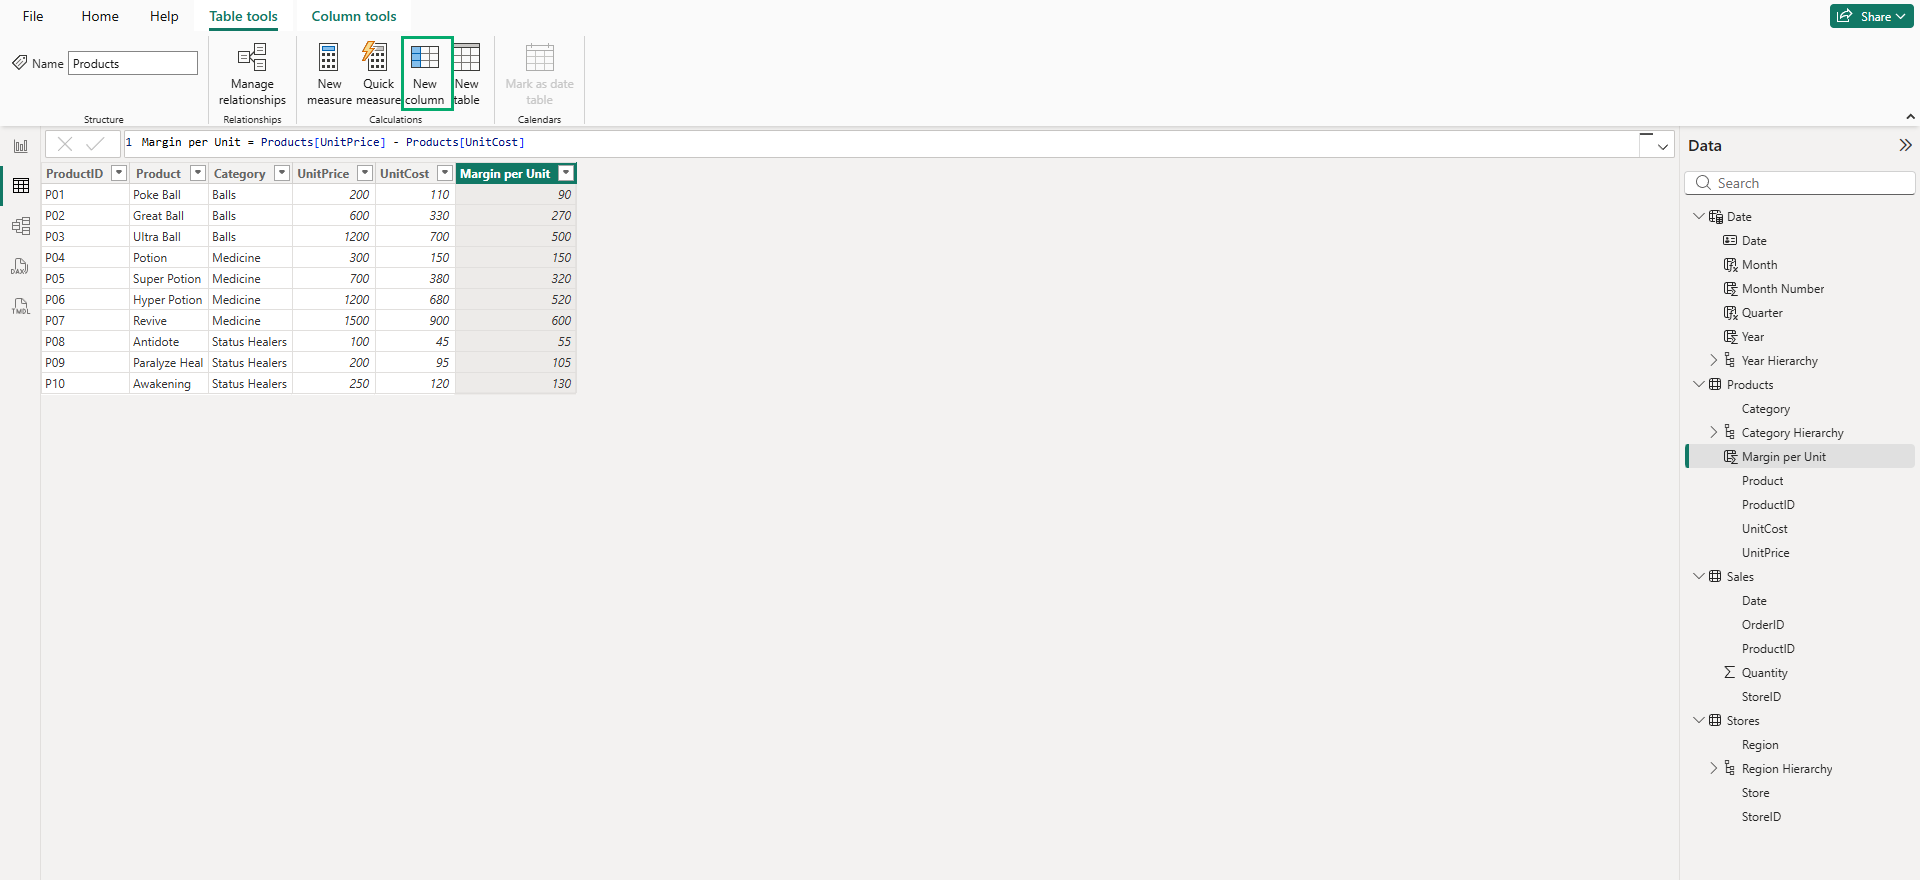
The new column appears at the right end of the table.
The numbers below have a thousands separator.
In Table view, Power BI shows them without one, for example 1200:
| ABCProductID | ABCProduct | ABCCategory | 123UnitPrice | 123UnitCost | 123Margin per Unit |
|---|---|---|---|---|---|
| P01 | Poke Ball | Balls | 200 | 110 | 90 |
| P02 | Great Ball | Balls | 600 | 330 | 270 |
| P03 | Ultra Ball | Balls | 1,200 | 700 | 500 |
| P04 | Potion | Medicine | 300 | 150 | 150 |
| P05 | Super Potion | Medicine | 700 | 380 | 320 |
| P06 | Hyper Potion | Medicine | 1,200 | 680 | 520 |
| P07 | Revive | Medicine | 1,500 | 900 | 600 |
| P08 | Antidote | Status Healers | 100 | 45 | 55 |
| P09 | Paralyze Heal | Status Healers | 200 | 95 | 105 |
| P10 | Awakening | Status Healers | 250 | 120 | 130 |
Ultra Ball and Hyper Potion have the same price, 1,200, but the shop earns 20 more on each Hyper Potion.
Revive earns the most per unit: 600.
In the Data pane, the new column has a special icon.
It shows that the values come from a formula.
You can use Margin per Unit like any other column: in a table visual, on the axis of a chart, or in a slicer.
Why Sales[Quantity] * Products[UnitPrice] Does Not Work
The Sales table has a Quantity column, but no prices.
The prices are in the Products table.
So it seems natural to add this column to Sales:
Example (does not work)
Amount = Sales[Quantity] * Products[UnitPrice]
Try it: in Table view, select the Sales table, select New column, enter the formula and press Enter.
Power BI shows an error under the formula bar.
It starts with "A single value for column 'UnitPrice' in table 'Products' cannot be determined."
The Amount column is still created, but every cell shows #ERROR, and the Data pane shows a warning icon next to Amount.
Here is why.
The row context is on the Sales table.
For each Sales row, DAX knows the Quantity of that row.
But Products[UnitPrice] is a column in another table, with 10 different prices.
DAX does not know which of the 10 prices you mean.
You know the answer: the price of the product in the current order.
Each Sales row has a ProductID, and the relationship between Sales and Products connects it to exactly one product.
But a plain column reference does not follow relationships.
You have to ask for that with the RELATED function:
Example
Amount = Sales[Quantity] * RELATED(Products[UnitPrice])
You create this column in the next chapter.
Note: If you tried the formula, leave the Amount column with the errors.
In the next chapter, you replace its formula.
Calculated Column or Power Query?
In the Power Query Columns chapter, you added a Sales column with Add Column > Custom Column.
That also gives a value for each row.
So what is the difference?
| Power Query custom column | DAX calculated column | |
|---|---|---|
| Language | M | DAX |
| Calculated | While the data is loaded | From the data already in the model |
| Using other tables | Usually by merging the queries first, as in Power Query Merge | Through relationships, with RELATED |
For simple calculations, both work.
In this chapter we use DAX, because the model already has the tables and the relationships.
Note: Calculated columns are stored in the model, so every calculated column makes the file bigger.
That does not matter for 10 products, but it does for a table with millions of rows.
For totals and ratios, use measures instead.
You learn them in DAX Measures.







