
Power BI Pie and Donut Charts
Pie and Donut Charts
A pie chart shows how a total is split into parts.
Each slice is one category, and the size of the slice is that category's share of the total.
A donut chart is a pie chart with a hole in the middle.
Both answer one question: "What share of the whole does each part have?"
They work best with only a few parts.
This page uses your file from the DAX chapter, for example poke_mart_dax.pbix (see Power BI Visuals for what it holds), with the measure Total Sales.
Create a Pie Chart
Show each product category's share of Total Sales:
- Click an empty spot on the canvas.
- In the Visualizations pane, select Pie chart.
- Drag Products > Category to the Legend well.
- Drag Sales > Total Sales to the Values well.
The pie has three slices.
By default, each label shows the value and the share (Data value, percent of total).
To label each slice with its name and share instead, select Format visual, open the Visual tab, expand Detail labels > Options, and set Label contents to Category, percent of total.
| Category | Total Sales | Share of total |
|---|---|---|
| Balls | 4,447,200 | 47.23% |
| Medicine | 4,413,600 | 46.87% |
| Status Healers | 556,000 | 5.90% |
| Total | 9,416,800 | 100.00% |
The pie makes one thing clear at a glance: Balls and Medicine each bring in almost half of the sales, and Status Healers only about 6%.
The shares always add up to 100%.
That is why a pie only makes sense when the parts together form a meaningful whole, like the three categories that make up all sales.
Create a Donut Chart
- Select the pie chart, and copy and paste it (Ctrl+C, Ctrl+V).
- With the copy selected, select Donut chart in the Visualizations pane.
The donut uses the same wells and shows the same shares as the pie.
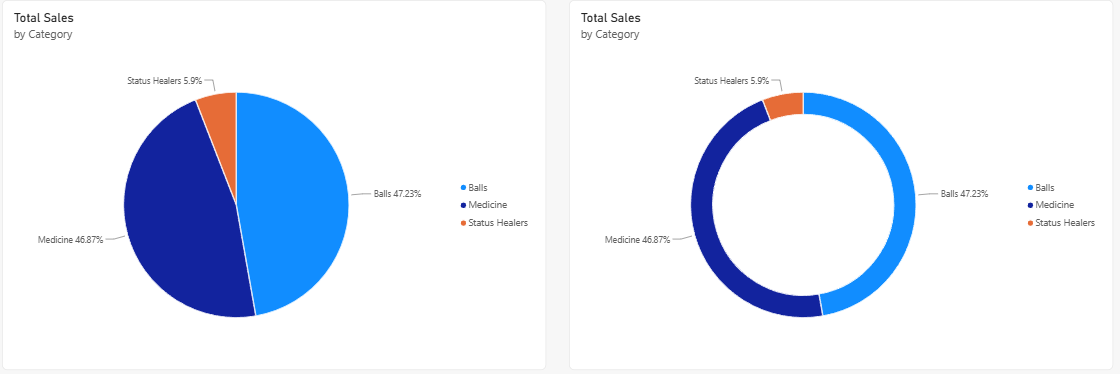
The hole in the middle leaves room for a label.
Center value, on the Visual tab of Format visual, is on by default and shows the total inside the ring, shortened to 9M.
The donut in the image has it turned off.
Otherwise, pie and donut charts work the same.
Choose the one you find easier to read.
When Not to Use a Pie Chart
Pie charts are popular, but they are easy to misuse.
Avoid them in these two cases.
1. Too Many Slices
Change the pie from categories to products: drag Products > Product to the Legend well, and remove Category.
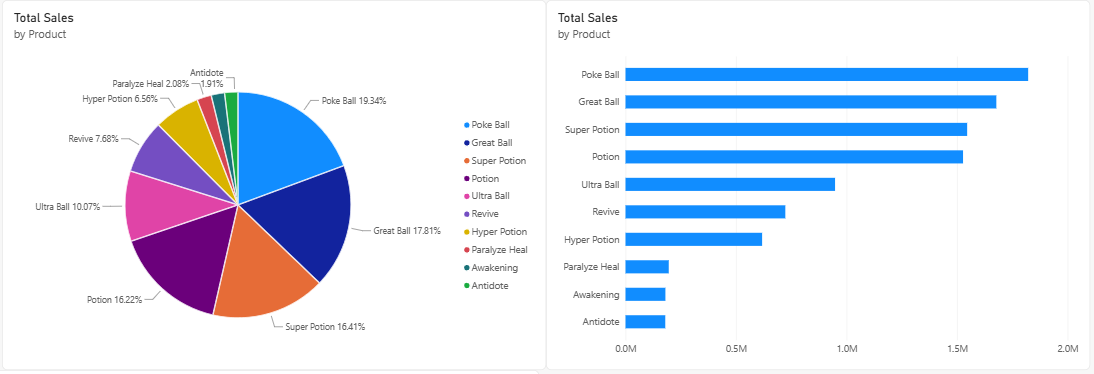
The pie now has ten slices:
| Product | Total Sales | Share of total |
|---|---|---|
| Poke Ball | 1,821,600 | 19.34% |
| Great Ball | 1,677,600 | 17.81% |
| Super Potion | 1,545,600 | 16.41% |
| Potion | 1,527,000 | 16.22% |
| Ultra Ball | 948,000 | 10.07% |
| Revive | 723,000 | 7.68% |
| Hyper Potion | 618,000 | 6.56% |
| Paralyze Heal | 195,600 | 2.08% |
| Awakening | 180,500 | 1.92% |
| Antidote | 179,900 | 1.91% |
| Total | 9,416,800 | 100.00% |
Ten colors are hard to match with the legend.
Super Potion and Potion look the same size.
The three smallest slices, Paralyze Heal, Awakening and Antidote, are thin wedges of about 2% each, and their labels crowd each other or disappear.
Microsoft recommends pie and donut charts for a small number of categories.
For ten products, use a bar chart sorted by value, like the one in Bar and Column Charts.
It shows the same ranking at a glance.
2. Slices That Are Hard to Compare
Go back to the three categories.
Which sells more, Balls or Medicine?
In the pie you cannot tell.
The slices are 47.23% and 46.87%, a difference of 33,600 in sales.
People judge angles and areas much less exactly than lengths, so two slices of almost the same size look equal.
If the order or the difference matters, use a bar chart sorted by value, add data labels, or show the numbers in a table.
Two or more pies side by side, for example one pie per region, are even harder to compare.
To compare the mix between groups, use a 100% stacked column chart instead.
Note: Use a pie or donut chart only when all of these are true: the parts add up to a meaningful whole, there are only a few parts, and the reader needs a rough idea of the shares, not exact comparisons.
Treemap: An Alternative
A treemap also shows the parts of a whole, but as rectangles instead of slices.
Select Treemap, put Category in the Category well, Product in the Details well and Total Sales in the Values well: each category becomes a colored block, split into one rectangle per product and sized by its sales.
Power BI places the largest rectangle at the top left and the smallest at the bottom right, so the ranking is easy to read, and a treemap has room for many more parts than a pie, all ten products in their three categories at once.







