
Power BI Relationships
What Is a Relationship?
A relationship connects a column in one table to a column in another table.
In the Poke Mart model, the ProductID column in Sales is connected to the ProductID column in Products.
For each order, Power BI can find the matching product, and with it the product name and the category.
In Power BI, Sales[ProductID] means "the ProductID column in the Sales table".
You will see columns written this way in DAX formulas too.
The model from the Star Schema chapter has two relationships:
| From (many side) | To (one side) |
|---|---|
| Sales[ProductID] | Products[ProductID] |
| Sales[StoreID] | Stores[StoreID] |
Thanks to these relationships, a visual can add up Sales by Category, even though Category is a column in Products, and by Region, even though Region is a column in Stores.
Relationships in Model View
Open poke_mart_model.pbix from the previous chapter, and select Model view on the left side of the window.
Each relationship is a line between two tables.
Point to a line to highlight the two columns it connects.
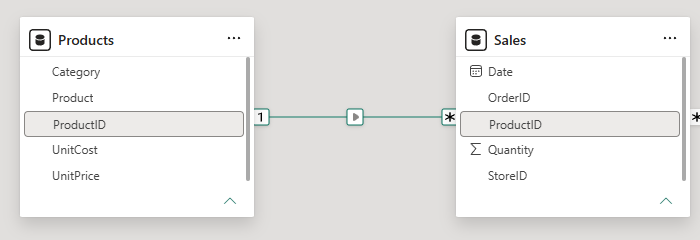
Look at the ends and the middle of the line:
- A 1 at the Products end: each ProductID appears once in Products.
- A * (many) at the Sales end: the same ProductID appears on many rows of Sales.
- An arrow in the middle: the direction in which filters travel. The next chapter explains it.
Select a line to see the settings of that relationship in the Properties pane.
Autodetect
You did not create the two relationships.
Power BI did it for you.
Each time data is loaded, Power BI looks for columns with the same name in different tables.
On the first load it found ProductID in Sales and in Products.
The StoreID column in Stores only got its name when you fixed the Stores headers, so Power BI found StoreID in Sales and in Stores after Close & Apply.
In Products and Stores the IDs are unique, so Power BI created the relationships.
If Power BI is not confident that two columns match, it creates nothing.
For example, it would not match a column named ProductID with a column named ItemCode.
You can run autodetect again at any time: on the Modeling tab, select Manage relationships > Autodetect.
Autodetect on load is an option.
You find it in File > Options and settings > Options, under CURRENT FILE > Data Load, in the Relationships section: Autodetect new relationships after data is loaded.
What Goes Wrong Without a Relationship
To see why relationships matter, delete one and look at the result:
- In Model view, on the Home tab, select Manage relationships.
- Select the relationship between Sales (ProductID) and Products (ProductID).
- Select Delete. Power BI asks if you want to delete the relationship: select Delete again.
- Select Close.
The line between Sales and Products is gone.
Now build a table visual:
- Select Report view and click an empty spot on the canvas.
- In the Visualizations pane, select Table.
- In the Data pane, expand Products and select Category.
- Expand Sales and select Quantity.
Power BI adds up Quantity, in a column called Sum of Quantity.
Power BI shows the sums without a thousands separator, such as 24488. The tables in this chapter add the separator to make the numbers easier to read: 24,488.
Look at the result:
| Category | Sum of Quantity |
|---|---|
| Balls | 24,488 |
| Medicine | 24,488 |
| Status Healers | 24,488 |
| Total | 24,488 |
Every category shows 24,488. That is the total number of units in all 2,740 orders.
Without a relationship, Power BI cannot tell which orders belong to which category.
So for each category, it adds up every row in Sales.
Note: The same number on every row is the classic sign of a missing or wrong relationship.
When you see it, check Model view first.
Create a Relationship by Dragging
The quickest way to create a relationship is to drag one column onto another in Model view:
- Select Model view.
- In the Sales table, find ProductID.
- Drag it onto ProductID in the Products table, and let go.
- The New relationship dialog opens, with ProductID already selected in both tables, Many to one (*:1) and Single. Select Save.
A new line connects Sales and Products.
Power BI looks at the data and sets the details for you: many Sales rows to one Products row.
Go back to Report view.
The table visual now shows the real numbers:
| Category | Sum of Quantity |
|---|---|
| Balls | 12,694 |
| Medicine | 8,295 |
| Status Healers | 3,499 |
| Total | 24,488 |
The total is still 24,488, but now it is split between the categories.
Balls sell the most units: Poke Balls alone account for 9,108 of them.
You can keep this table visual to experiment with, or delete it.
The next chapter builds its own.
Manage Relationships
The Manage relationships dialog lists every relationship in the model.
Open it from the Modeling tab in Report view, or from the Home tab in Model view.
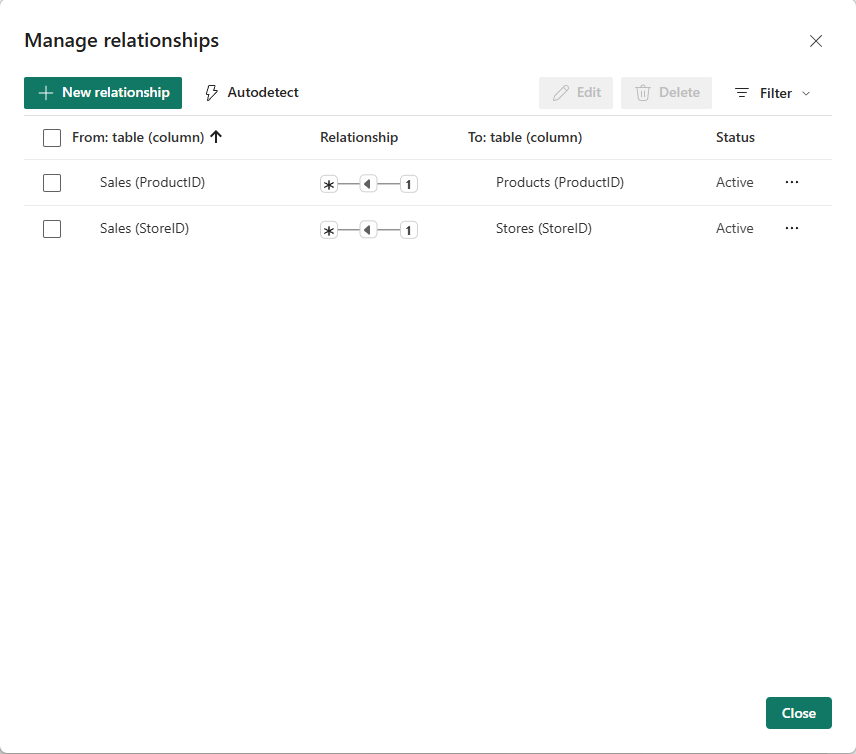
From here you can create, edit and delete relationships, and run Autodetect.
This is how you create a relationship in the dialog, instead of dragging.
You already have the Sales to Products relationship, so just read along:
- Select New relationship. The New relationship dialog opens.
- In the From table list, select the Sales table, then select its ProductID column in the preview.
- In the To table list, select the Products table, then select its ProductID column in the preview.
- Keep the default options and select Save.
- Select Close.
Both ways give the same relationship. Dragging is faster.
The dialog shows a preview of both tables, which helps when the column names are not the same.
Edit a Relationship
To see or change the settings of a relationship, open the Edit relationship dialog.
In Model view, double-click the line between Sales and Products.
You can also select the relationship in Manage relationships and select Edit.
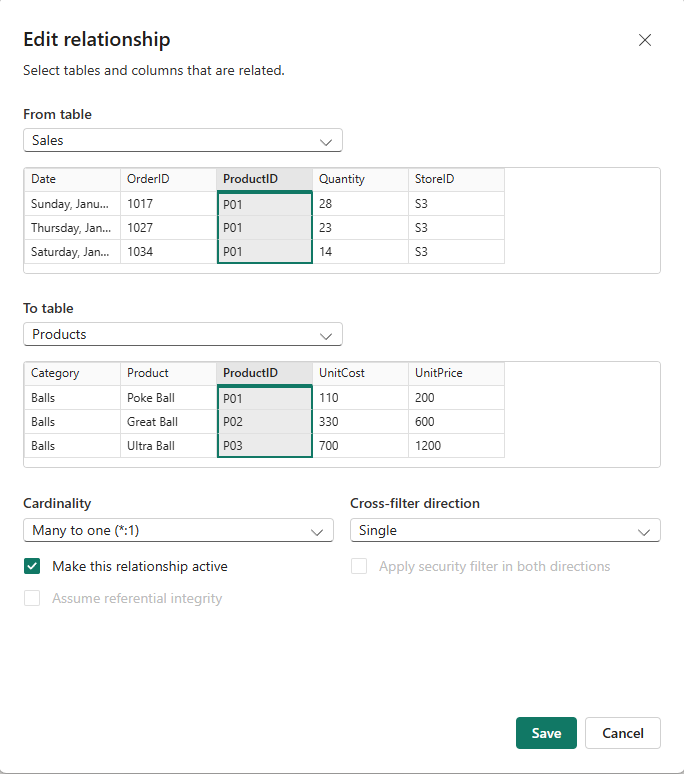
The top of the dialog shows the two tables with the related columns selected. Below are the settings:
| Setting | Value here | Meaning |
|---|---|---|
| Cardinality | Many to one (*:1) | Many Sales rows match one Products row |
| Cross-filter direction | Single | Filters travel from Products to Sales |
| Make this relationship active | Selected | Power BI uses this relationship by default |
The next chapter, Cardinality and Cross-Filter Direction, explains the first two settings.
For now, select Cancel to close the dialog without changes.
Inactive Relationships
Two tables can have more than one relationship between them, but only one can be active at a time.
For example, if Sales had both an order date and a ship date, both columns could be related to a Date table.
Power BI uses the active relationship by default, and draws the others as dashed lines in Model view.
To use an inactive relationship, you switch it on inside a DAX formula with the USERELATIONSHIP function, together with CALCULATE.
The Poke Mart model has only one date column in Sales, so it needs no inactive relationships.







