
Power BI Get Started
Get Power BI Desktop
Power BI Desktop is free.
It runs on Windows only.
There are two ways to install it:
- Microsoft Store (recommended). Windows updates Power BI Desktop automatically in the background, and you do not need administrator rights to install it.
- Microsoft Download Center. You download an installer file and run it. You need administrator rights, and you have to install each update yourself.
To install from the Microsoft Store:
- Open the Power BI Desktop page in the Microsoft Store, or open the Microsoft Store app and search for Power BI Desktop.
- Select Install.
- When the installation is done, open Power BI Desktop from the Start menu.
If you prefer the installer, go to the Microsoft Download Center and choose the 64-bit version.
Power BI Desktop needs Windows 10 or later, at least 2 GB of free memory (4 GB or more is recommended), and a screen resolution of at least 1440x900.
Open Power BI Desktop
When Power BI Desktop starts, you see its start screen.
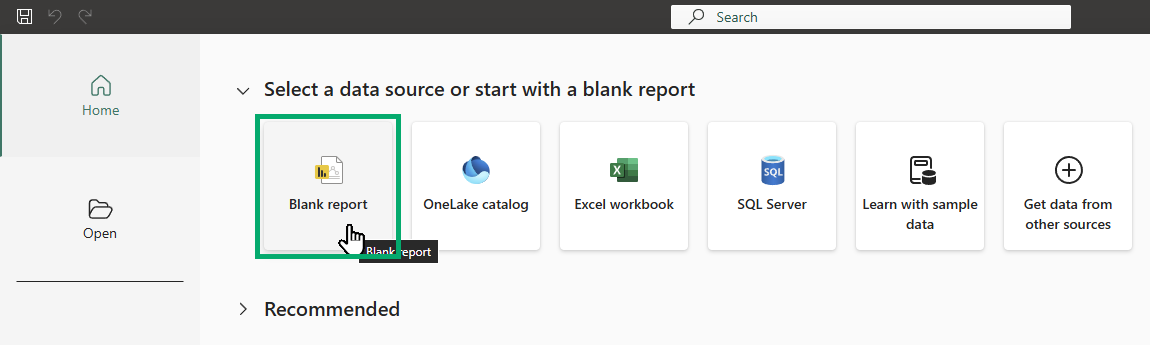
To begin, select Blank report, under Select a data source or start with a blank report. An empty report opens.
Do not worry if the program looks busy at first.
The next chapter explains each part of the window.
Note: Microsoft updates Power BI Desktop every month.
Buttons can move or get new names, so your screen may look slightly different from the pictures in this tutorial.
The steps stay the same.
Power BI on a Mac
There is no version of Power BI Desktop for macOS.
If you use a Mac, you have two options:
- Use the Power BI service in a web browser. You can view reports and build simple ones there. You need a work or school account, and the service does not have all the tools of Power BI Desktop, so many steps in this tutorial will not match.
- Run Windows on your Mac. Use a Windows virtual machine on your Mac, or a Windows cloud PC such as Windows 365, and install Power BI Desktop there.
Do You Need an Account?
No.
You can build and save reports in Power BI Desktop without signing in.
You only need to sign in when you want to publish a report to the Power BI service.
The Power BI service needs a work or school account.
Personal email addresses, such as Gmail, Outlook.com or Hotmail addresses, cannot be used to sign up.
Licenses
Power BI Desktop is free, and you do not need a license to build reports with it.
The Power BI service also has a free license, but with it you can only keep reports for yourself, in your own My workspace.
To share reports with other people, you need a paid license (Power BI Pro or Premium Per User), or your organization must put the report in a workspace that runs on paid capacity.
Some Microsoft 365 plans for work already include Power BI Pro, so ask your IT department before you buy anything.
You do not need any license until the chapters about publishing and sharing.
Download the Practice Data
In this tutorial you work with sales data from the Poke Mart, the Pokemon shop you may know from our Excel tutorial.
The file has one sheet, Sales, with 2,740 orders from January 1, 2024 to December 31, 2025, from six stores in three regions.
Save the file in a folder you can find again, for example your Documents folder.
The same data is also available as a CSV file: poke_mart_sales.csv.
The first rows of the Sales sheet look like this:
| A | B | C | D | E | F | G | H | I | J | |
|---|---|---|---|---|---|---|---|---|---|---|
| 1 | OrderID | Date | Store | Region | Product | Category | Quantity | UnitPrice | Sales | Cost |
| 2 | 1001 | 2024-01-01 | Lilycove City | Hoenn | Hyper Potion | Medicine | 1 | 1200 | 1200 | 680 |
| 3 | 1002 | 2024-01-01 | Cerulean City | Kanto | Poke Ball | Balls | 19 | 200 | 3800 | 2090 |
| 4 | 1003 | 2024-01-02 | Lilycove City | Hoenn | Great Ball | Balls | 13 | 600 | 7800 | 4290 |
| 5 | 1004 | 2024-01-02 | Cerulean City | Kanto | Antidote | Status Healers | 9 | 100 | 900 | 405 |
| 6 | 1005 | 2024-01-03 | Violet City | Johto | Potion | Medicine | 19 | 300 | 5700 | 2850 |
Each row is one order line. The columns are:
| Column | What it holds |
|---|---|
| OrderID | A unique number for each order |
| Date | The day of the order |
| Store | The Poke Mart store, for example Goldenrod City |
| Region | Kanto, Johto or Hoenn |
| Product | The item sold, for example Poke Ball or Potion |
| Category | Balls, Medicine or Status Healers |
| Quantity | How many items were sold |
| UnitPrice | The price of one item |
| Sales | Quantity multiplied by UnitPrice |
| Cost | What the items cost the shop |
Keep the file handy.
You will load it into Power BI Desktop in the First Report chapter.







