
Power BI Visuals
What Is a Visual?
A visual is one chart, table, card or slicer on a report page.
Visuals are also called visualizations.
In the First Report chapter you built a card, a column chart, a slicer and a line chart from one flat table.
Now your model is much richer.
It has the Sales, Products, Stores and Date tables, the hierarchies, and the DAX measures from the previous chapters.
In this chapter you use that model to build every common type of visual.
Open the Power BI file you worked in during the DAX chapter, for example poke_mart_dax.pbix.
It holds the Poke Mart model from DAX Introduction, the hierarchies from Hierarchies (Year Hierarchy in Date, Category Hierarchy in Products and Region Hierarchy in Stores), and these measures, all stored in the Sales table:
- Total Sales, from DAX Measures
- Total Cost, Units Sold and Order Count, from DAX Aggregations
- Profit, Margin % and Avg Order Value, from DAX DIVIDE
- Sales LY and Sales YoY %, from DAX Time Intelligence
If you start here, build the model and these measures first.
Each page of this chapter names the measures it uses.
In this chapter, as in the DAX Measures chapter, measures are formatted as Whole number with a thousands separator.
The percentage measures (Margin %, % of All Regions and Sales YoY %) are formatted as Percentage with 2 decimals, and Avg Order Value as Decimal number with 2 decimals.
The tables of expected values use the same formats.
Charts may shorten large numbers on their axes, for example to 3M.
Point to a column, bar or point to see its exact value in a tooltip.
The Visualizations Pane
You build and change visuals in the Visualizations pane, to the right of the canvas.
The pane has three parts.
Switch between them with the icons at the top of the pane:
| Part | What you do there |
|---|---|
| Build visual | Choose a visual type from the gallery, and put fields in the field wells. |
| Format visual | Change how the selected visual looks. It has two tabs: Visual, with settings for this type of visual, such as axes, colors and data labels, and General, with settings that almost every visual has, such as size, title and background. |
| Analytics | Add reference lines, such as an average line, a constant line or a trend line. Only some visuals support them. |
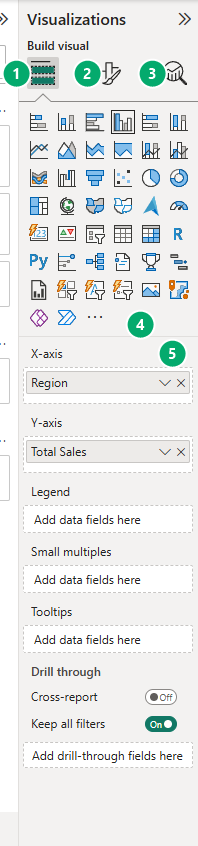
The pane always shows the settings of the selected visual:
- If no visual is selected, selecting a visual type in the gallery adds a new, empty visual to the canvas.
- If a visual is selected, selecting a visual type changes that visual to the new type.
The gallery holds the built-in visuals.
You can add more visuals from Microsoft AppSource with Get more visuals, but this tutorial uses only the built-in ones.
This is the Format visual part, with its two tabs:
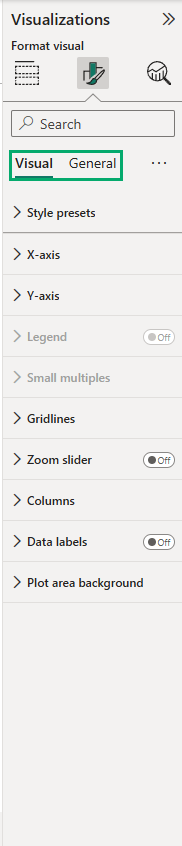
You will format visuals in detail in the Format Visuals chapter.
The Field Wells
Below the gallery, the Build visual part shows the field wells.
A field well is a box that decides what a field does in the visual.
Each visual type has its own wells:
| Visual | Main wells |
|---|---|
| Clustered column chart | X-axis (categories), Y-axis (values), Legend |
| Clustered bar chart | Y-axis (categories), X-axis (values), Legend |
| Line chart | X-axis, Y-axis, Secondary y-axis, Legend |
| Pie chart | Legend, Values |
| Table | Columns |
| Matrix | Rows, Columns, Values |
Most charts also have a Tooltips well, for extra values that appear when you point to a data point, and a Small multiples well, which splits the chart into one small chart per value.
There are three ways to put a field in a well:
- Select the check box next to the field in the Data pane. Power BI picks the well.
- Drag the field from the Data pane to a well.
- Drag the field onto the visual on the canvas.
To remove a field from a well, select the X next to it.
As a rule, a measure such as Total Sales goes in a value well (Y-axis, Values).
A column that you group by, such as Region, goes in a category well (X-axis, Legend, Rows).
Example: Same Fields, Three Visuals
Let's see what the wells do.
Tip: add a new report page for each chapter (select + next to the page tabs), so the visuals do not crowd each other.
- Click an empty spot on the canvas, so no visual is selected.
- In the Visualizations pane, select Clustered column chart. If the pane shows the settings of the page instead of the gallery, select the Build visual icon first.
- In the Data pane, expand Stores and select Region. Then expand Sales and select Total Sales.
Power BI puts Region in the X-axis well and Total Sales in the Y-axis well.
You get one column per region:
| Region | Total Sales |
|---|---|
| Hoenn | 2,972,000 |
| Johto | 3,363,650 |
| Kanto | 3,081,150 |
Now change the type of the same visual:
- With the chart selected, select Clustered bar chart. The columns turn into horizontal bars. Look at the wells: Region is now in the Y-axis well and Total Sales in the X-axis well, because a bar chart has its categories on the vertical axis.
- Select Table. Both fields move to the Columns well, and the visual shows the numbers themselves, with a Total row at the bottom.
The table shows exactly the same numbers as the charts, plus the total:
| Region | Total Sales |
|---|---|
| Hoenn | 2,972,000 |
| Johto | 3,363,650 |
| Kanto | 3,081,150 |
| Total | 9,416,800 |
The data did not change.
Only the way it is drawn changed.
Choosing a visual means choosing how your readers see the numbers.
Choosing a Visual
Start with the question the visual should answer.
Then pick the visual from this table:
| I want to show... | Visual | Chapter |
|---|---|---|
| One important number, such as total sales | Card | Card and KPI |
| A number compared with a target | KPI | Card and KPI |
| Exact values, with several measures side by side | Table | Table and Matrix |
| Values across rows and columns, with subtotals | Matrix | Table and Matrix |
| A comparison of a few categories, such as sales by region | Clustered column or bar chart | Bar and Column Charts |
| A comparison of many categories, or categories with long names | Clustered bar chart | Bar and Column Charts |
| The parts that make up each category's total | Stacked column or bar chart | Bar and Column Charts |
| A trend over time, such as sales by month | Line chart | Line and Area Charts |
| A trend over time, and how big the total is | Area or stacked area chart | Line and Area Charts |
| Two measures with very different scales, such as sales and margin | Line and clustered column chart | Line and Area Charts |
| The share of a whole, with only a few parts | Pie or donut chart | Pie and Donut Charts |
| The share of a whole, with many parts | Treemap | Pie and Donut Charts |
| The relationship between two measures | Scatter chart | Scatter Charts |
| A filter that readers can use on the page | Slicer | Slicers |
When in doubt, start with a bar or column chart.
Bars are easy to compare, because they all start from the same baseline.
Use a table when readers need to look up exact values, and a chart when they need to see a pattern.
Note: Power BI also has map visuals, such as Azure Maps, Map and Filled map.
They place values on a real map, based on place names or coordinates.
This tutorial does not cover maps: the Poke Mart stores are in fictional Pokemon cities, so a map visual could not place them correctly.
To compare stores, use a bar chart instead.
In This Chapter
The next pages build each type of visual from the Poke Mart model:
- Table and Matrix: exact values, totals and subtotals
- Bar and Column Charts: clustered, stacked and 100% stacked, sorting and data labels
- Line and Area Charts: trends by month, this year vs last year, and a combo chart
- Pie and Donut Charts: shares of a total, and when to avoid them
- Card and KPI, Scatter Charts and Slicers
- Format Visuals and Conditional Formatting







