
Power BI Slicers
What Is a Slicer?
A slicer is a filter that sits on the report canvas.
Readers see it, and they can change it with one click.
You made a Region slicer in the First Report chapter.
This chapter shows the other kinds of slicers, and the settings that control how they behave.
Work in your file from the DAX chapter, for example poke_mart_dax.pbix (see Power BI Visuals for what it holds).
The page uses the measures Total Sales and Order Count, and the Date table from Date Table.
The Slicer visual has several styles.
You choose one in Format visual > Visual > Slicer settings > Options > Style:
| Style | Works with | What it looks like |
|---|---|---|
| Dropdown | Text, numbers, dates, hierarchies | A box that opens a list. Takes the least space. |
| Vertical list | Text, numbers, dates, hierarchies | All values in a list with check boxes |
| Tile | Text, numbers | Buttons, in rows that wrap to fit the slicer |
| Between | Dates, numbers | A slider with two handles, for a range |
| Before, After | Dates, numbers | A slider with one handle, for "up to" or "from" |
| Relative date | Dates | Rolling periods such as "last 7 days" |
| Relative time | Date and time | Rolling periods such as "last 2 hours" |
| Date picker | Dates | A calendar and a slider, with relative choices |
List, Tile and Dropdown
The three styles for text values look different, but they filter the same way:
- Click an empty spot on the canvas and select Slicer in the Visualizations pane.
- In the Data pane, select Region from the Stores table.
- A new slicer on a text column starts as a Vertical list with check boxes. To change that, select Format visual, and on the Visual tab expand Slicer settings > Options. Set Style to Tile or Dropdown.
The screenshot shows the same slicer three times, once in each style:

Whatever the style, selecting a region filters the page to that region.
To see it, add a Card with the Total Sales measure.
Then select a region in the slicer.
The card shows the region's total, shortened (for example 3M for Hoenn). The exact values are:
| Selected in the slicer | Total Sales |
|---|---|
| Nothing (no filter) | 9,416,800 |
| Hoenn | 2,972,000 |
| Johto | 3,363,650 |
| Kanto | 3,081,150 |
Which style should you use?
- Vertical list when there are few values and readers should see them all at once.
- Tile for a few short values, such as regions or years, in a row across the page.
- Dropdown when there are many values, or little space.
Power BI also has a separate Button slicer visual.
It shows the values as buttons, like Tile, but with more formatting choices: images, grid layouts and hover effects.
You find it next to the Slicer in the Visualizations pane.
Date Range Slicer: Between
For a date column, a range is often more useful than a list of 731 single days.
- Click an empty spot on the canvas and select Slicer.
- In the Data pane, select Date from the Date table.
- A new slicer on a date column starts as a Between slider, with two date boxes above it.
- Drag the two handles, or type the dates into the two boxes. Type 7/1/2025 in the first box and 12/31/2025 in the second.
The dates show in the short date format of your computer, so they can look different from the example.
The page now shows the second half of 2025, and the card shows 3M.
Then also select Kanto in the Region slicer: the card shows 917K.
To see the Order Count column too, add a second card with Order Count:
| Filter | Total Sales | Order Count |
|---|---|---|
| 7/1/2025 to 12/31/2025 | 2,847,850 | 830 |
| 7/1/2025 to 12/31/2025, and Kanto in the Region slicer | 917,100 | 272 |
Check: 2,847,850 is the sum of the third and fourth quarter of 2025 (1,452,100 + 1,395,750).
The second row shows that slicers work together: the page shows only rows that match both slicers.
Note: The Relative date style counts back from today, for example "last 3 months".
The Poke Mart data ends on December 31, 2025, so a period that ends today finds no sales.
To use a rolling period with this data, set a fixed anchor date in the Relative date settings, or use the Date picker style, which can count back from the last date in the data.
Hierarchy Slicer
A slicer can hold more than one field.
It then shows a tree that readers can expand, like a folder list.
First clear Kanto in the Region slicer (select the eraser icon at the top of the slicer).
Keep the date slicer set to the second half of 2025.
- Click an empty spot on the canvas and select Slicer.
- Drag Category and then Product from the Products table to the Field well, in that order. You can also drag in the Category and Product hierarchy you made in Hierarchies.
- The slicer starts as a Vertical list. Keep that style. Hierarchies work with Vertical list and Dropdown, but not with Tile.
Each category now has an arrow next to it.
Select the arrow to see its products.
Select a category to filter to all its products, or expand it and select only some of them.
In this slicer a plain click turns an item on or off, so you do not need Ctrl to select several.
To go from Medicine to only Potion and Super Potion, first clear the slicer with its eraser icon, and then select Potion and Super Potion.
With the date slicer still set, the card shows the first column, shortened: 1M for Medicine and 934K for Potion and Super Potion.
Clear the date slicer to see the second:
| Selected in the slicer | Total Sales, 7/1/2025 to 12/31/2025 | Total Sales, all dates |
|---|---|---|
| Medicine (all four products) | 1,344,500 | 4,413,600 |
| Medicine > Potion and Super Potion | 934,400 | 3,072,600 |
When only some products of a category are selected, the category shows a half-filled square instead of a check mark.
It tells readers that part of the category is selected.

The screenshot shows both slicers at work, so the card shows Potion and Super Potion in the second half of 2025 only: 934,400, shortened on the card to 934K.
Select All and Single Select
Three settings control how readers can select items.
You find them in Format visual > Visual > Slicer settings > Selection.
They work for the Vertical list, Tile and Dropdown styles.
| Setting | What it does |
|---|---|
| Single select | Readers can select only one item. In a vertical list, the check boxes become round radio buttons. Off by default. |
| Multi-select with CTRL | Readers select one item, or hold Ctrl to select several. On by default. |
| Show "Select all" option | Adds a Select all item at the top of the slicer. Off by default. |
Try it on the Region slicer, with a card that shows Total Sales:
| Action in the Region slicer | Total Sales |
|---|---|
| Select all | 9,416,800 |
| Single select on, select Kanto | 3,081,150 |
| Single select on, then select Johto | 3,363,650 |
With Single select on, selecting Johto replaces Kanto.
It does not add to it.
Note: Select all does not filter anything.
It gives the same result as selecting nothing.
If you select all and then clear Kanto, Power BI stores the filter as "Region is not Kanto".
A new region added to the data later would then be included automatically.
Sync Slicers Across Pages
A slicer filters only its own page.
To make one slicer work on several pages, sync it:
- Add a new page with the + button next to the page tabs, and put a card with Total Sales on it.
- Go back to the page with the Region slicer, and select the slicer.
- On the View tab, select Sync slicers. The Sync slicers pane opens between the Filters and Visualizations panes. It lists all pages of the report.
- Look at the row of the slicer's own page. Only its box in the Visible column (the eye icon) is checked. Select its box in the Sync column (the circular arrows icon) too. Without it, the other pages are not filtered.
- For the new page, select the check box in the Sync column. Power BI also checks its Visible box, so a copy of the slicer appears on that page. The slicer's selection now also filters that page.
- Select the check box in the Visible column too. The slicer now also appears on that page.
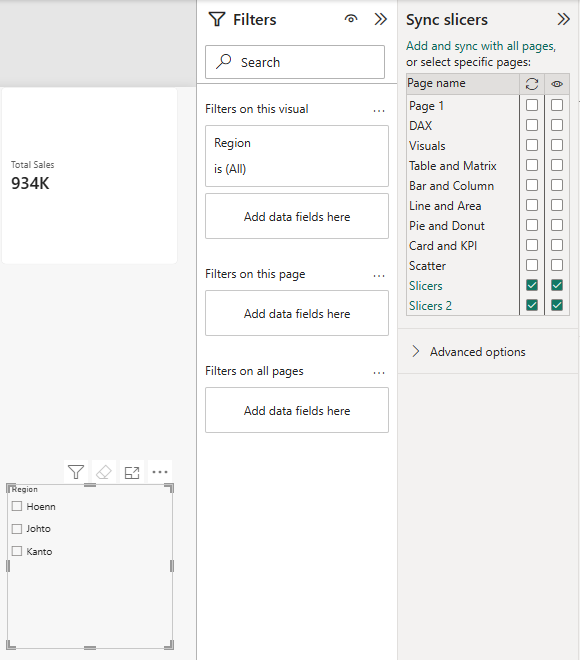
Select Johto on the first page, and then open the new page:
| Page | Region slicer | Total Sales card |
|---|---|---|
| First page | Johto | 3,363,650 |
| New page (synced) | Johto, selected for you | 3,363,650 |
The synced copies of the slicer can have their own size and position on each page.
Note: A page can be synced without being visible.
The page is then filtered by a slicer that readers cannot see there.
Use this with care, or readers will wonder why the numbers are smaller than they expect.
Slicer or Filters Pane?
The Filters pane can filter the same data as a slicer.
It has three levels: Filters on this visual, Filters on this page and Filters on all pages.
| Slicer | Filters pane | |
|---|---|---|
| Where | On the canvas, always visible | In a pane beside the canvas. Readers must open it. |
| Scope | One page, or several pages with Sync slicers | One visual, one page, or all pages |
| Best for | The few filters readers change often | Filters the author sets once, and filters readers seldom need |
A good rule: put the two or three filters readers use most as slicers on the page.
Use the Filters pane for the rest, such as the 2025 filter you put on the card and the KPI in Card and KPI Visuals.
By default, a slicer filters every visual on its page.
To keep one visual unfiltered, select the slicer, then select Format > Edit interactions on the ribbon, and select None on that visual.







