
Power BI Hierarchies
What Is a Hierarchy?
A hierarchy is a set of columns in order, from general to detailed.
A year has quarters, and a quarter has months. A region has stores.
In the First Report chapter, Power BI made a date hierarchy by itself, and you drilled from years down to quarters.
You turned that feature off in the Date Table chapter.
Now you build your own hierarchies.
You create three, one in each dimension table:
| Table | Hierarchy | Levels |
|---|---|---|
| Date | Year Hierarchy | Year > Quarter > Month |
| Products | Category Hierarchy | Category > Product |
| Stores | Region Hierarchy | Region > Store |
All the levels of a hierarchy must come from the same table.
That is one more reason why a star schema keeps related columns together: Category is in Products, next to Product, and Region is in Stores, next to Store.
Create the Date Hierarchy
Open poke_mart_model.pbix, the file you built in the Star Schema chapter and extended up to the Date Table chapter, then:
- Select Model view.
- In the Date table, right-click Year and select Create hierarchy. Power BI adds a hierarchy called Year Hierarchy, with Year as its first level.
- With the hierarchy selected, go to the Properties pane. In the Hierarchy section, use the Select a column to add level... list to add Quarter, and then Month, below Year.
- Select Apply Level Changes.
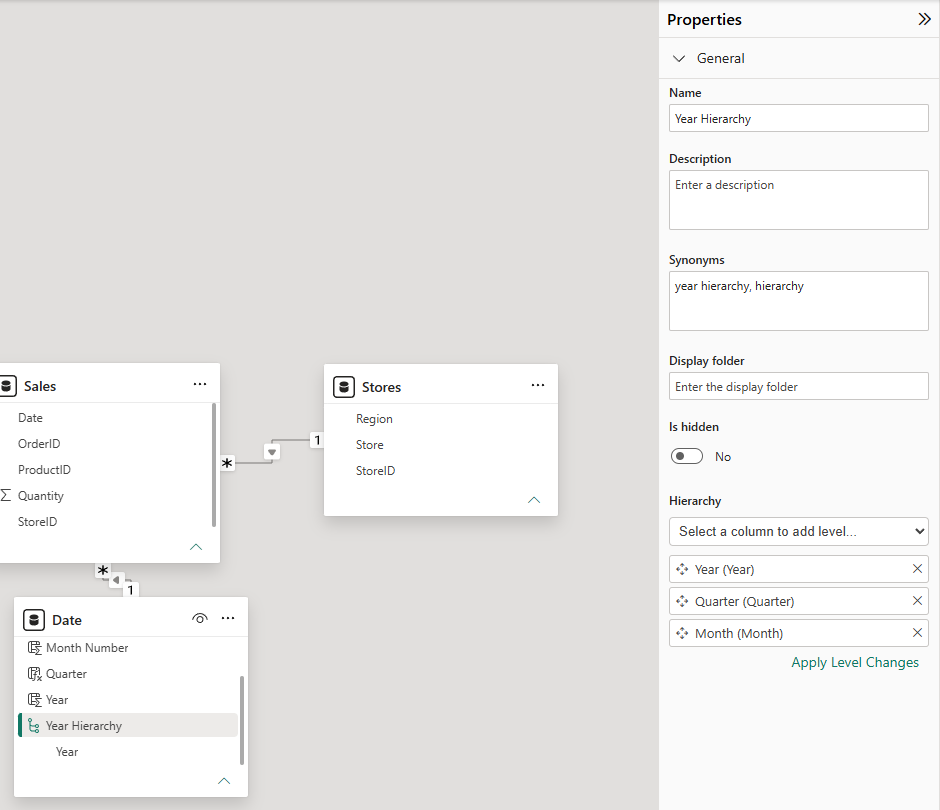
The picture shows the pane just before you select Apply Level Changes, so the Date table still lists only Year under the hierarchy.
Start with the most general column, and add the levels in order.
Power BI drills down in the same order: from Year to Quarter to Month.
A hierarchy does not move the columns.
Year, Quarter and Month are still in the Date table as normal columns too.
You can also build a hierarchy in the Data pane: right-click the first column and select Create hierarchy, then right-click each next column and select Add to hierarchy.
Create the Product and Store Hierarchies
Repeat the steps for the other two tables:
- In the Products table, right-click Category and select Create hierarchy. Add Product as the second level, and apply the changes.
- In the Stores table, right-click Region and select Create hierarchy. Add Store as the second level, and apply the changes.
In the Data pane, each table now shows its hierarchy.
Expand a hierarchy to see its levels.
If a hierarchy still shows only its first level, select the hierarchy again to update the list.
Drill Down in a Matrix
A matrix visual is a good place to use a hierarchy.
It works like a PivotTable in Excel.
- Select Report view, and click an empty spot on the canvas.
- In the Visualizations pane, select Matrix.
- In the Data pane, expand Stores and select Region Hierarchy. Both levels go into the Rows well.
- Expand Sales and select Quantity. Sum of Quantity goes into the Values well.
The matrix starts at the top level of the hierarchy, so it shows one row per region:
| Region | Sum of Quantity |
|---|---|
| Hoenn | 7,742 |
| Johto | 9,111 |
| Kanto | 7,635 |
| Total | 24,488 |
Point to the matrix, and the drill icons appear at the top or the bottom of the visual:
| Icon | What it does |
|---|---|
| Drill up | Goes back up one level. It is dimmed until you drill down. |
| Click to turn on drill down | Turns on drill mode. Then select one row or data point to see only its next level. |
| Go to the next level in the hierarchy | Replaces the current level with the next level, for all rows. |
| Expand all down one level in the hierarchy | Adds the next level below each row, and keeps the current level. |
Select Expand all down one level in the hierarchy.
Each region now shows its stores:
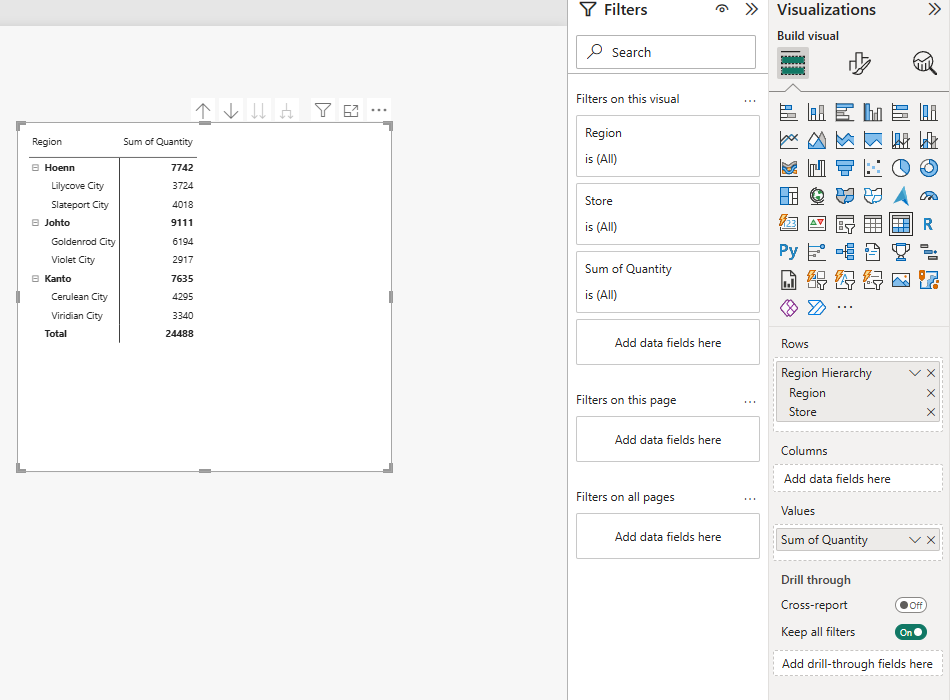
| Region / Store | Sum of Quantity |
|---|---|
| Hoenn | 7,742 |
| Lilycove City | 3,724 |
| Slateport City | 4,018 |
| Johto | 9,111 |
| Goldenrod City | 6,194 |
| Violet City | 2,917 |
| Kanto | 7,635 |
| Cerulean City | 4,295 |
| Viridian City | 3,340 |
| Total | 24,488 |
Johto sells the most units, and one store explains most of it: Goldenrod City alone sold 6,194 units, about a quarter of the total.
Now try the other icons:
- Select Drill up to go back to the three regions.
- Select Click to turn on drill down, then select Johto. The matrix shows only Johto, with its two stores, Goldenrod City (6,194) and Violet City (2,917), and a Total of 9,111. Select Drill up, and select the drill down icon again to turn drill mode off.
- Select Go to the next level in the hierarchy. The matrix shows all six stores, without the regions.
Drill Down the Dates
The Year Hierarchy works the same way.
With the matrix selected, remove Region Hierarchy from the Rows well, and select Year Hierarchy from the Date table instead.
The matrix shows the two years.
Select Expand all down one level in the hierarchy to see the quarters:
| Year / Quarter | Sum of Quantity |
|---|---|
| 2024 | 11,277 |
| Q1 | 2,372 |
| Q2 | 2,743 |
| Q3 | 3,171 |
| Q4 | 2,991 |
| 2025 | 13,211 |
| Q1 | 2,367 |
| Q2 | 3,321 |
| Q3 | 3,968 |
| Q4 | 3,555 |
| Total | 24,488 |
Q3 is the busiest quarter in both years.
Expand once more to see the months under each quarter.
They appear in calendar order, Jan to Dec, because you sorted Month by Month Number in the previous chapter.
Try It Yourself
Replace the hierarchy in the matrix with Category Hierarchy from Products, and expand it one level.
You should get these numbers:
| Category / Product | Sum of Quantity |
|---|---|
| Balls | 12,694 |
| Great Ball | 2,796 |
| Poke Ball | 9,108 |
| Ultra Ball | 790 |
| Medicine | 8,295 |
| Hyper Potion | 515 |
| Potion | 5,090 |
| Revive | 482 |
| Super Potion | 2,208 |
| Status Healers | 3,499 |
| Antidote | 1,799 |
| Awakening | 722 |
| Paralyze Heal | 978 |
| Total | 24,488 |
Hierarchies work in charts too.
Put a hierarchy on the X-axis of a column chart, and use the same drill icons.
You learn more about these visuals in the Table and Matrix and Bar and Column Charts chapters.
Your Finished Model
Good job! The Poke Mart model is now complete:
- One fact table, Sales, and three dimension tables: Products, Stores and Date.
- Three many-to-one relationships, all with Single cross-filter direction.
- A marked date table, with auto date/time turned off.
- Three hierarchies to drill through.
So far you have added up Quantity with a simple Sum of Quantity.
In the DAX chapter, you write your own calculations.
For example, a measure called Units Sold does the same as Sum of Quantity, and Total Sales adds up each quantity times its unit price from Products.







