
Power BI Power Query Editor
What is Power Query?
Power Query is the part of Power BI Desktop that gets your data ready before it goes into the report.
In Power Query you remove columns, fix data types, filter out bad rows, split columns and much more.
You do it with buttons and menus, not with code.
Power Query records every change as a step.
When the data is refreshed, Power Query runs all the steps again on the new data.
You clean the data once, and Power Query repeats the work for you every time.
Power Query never changes your source file.
It only changes the copy of the data that goes into your report.
Power Query is also built into Excel.
In Excel, select Data > Get Data to use it.
The editor looks and works almost the same, so what you learn in this chapter helps you in Excel too.
The Messy Data
In the First Report chapter, the data was already clean.
Real data is rarely that tidy.
In this chapter you clean a raw export of the Poke Mart sales for 2024, step by step.
Download the file to follow along:
Download poke_mart_raw_2024.csv
The file has 1,285 rows and seven columns: OrderID, OrderDate, Location, Product, Qty, Price and Notes.
It has the kind of problems you find in real exports.
Each page of this chapter fixes some of them:
| Problem | Example | Fixed in |
|---|---|---|
| A column you do not need | Notes is empty in most rows | Columns |
| Unclear column names | Qty, Price | Columns |
| No sales amount | Quantity times price is missing | Columns |
| Test rows | 3 rows with the product TEST ITEM | Filter Rows |
| Duplicate rows | 6 orders appear twice | Filter Rows |
| Two facts in one column | Lilycove City - Hoenn | Split and Merge |
| A typo in the region | Hoen instead of Hoenn (11 rows) | Replace and Fill |
| Product names written in different ways | poke ball, POKE BALL, extra spaces (286 rows) | Replace and Fill |
Later in the chapter you also add the 2025 file and the product categories.
At the end you have the same 2,740 orders and the same total sales (9,416,800) as in First Report.
Open the Power Query Editor
- Open Power BI Desktop and start a blank report.
- On the Home tab, select Get data > Text/CSV.
- Find poke_mart_raw_2024.csv and select Open.
- A preview window opens. Power BI has already chosen the settings: Delimiter is Comma, and Data Type Detection is Based on first 200 rows. Keep them.
- Select Transform Data, not Load.
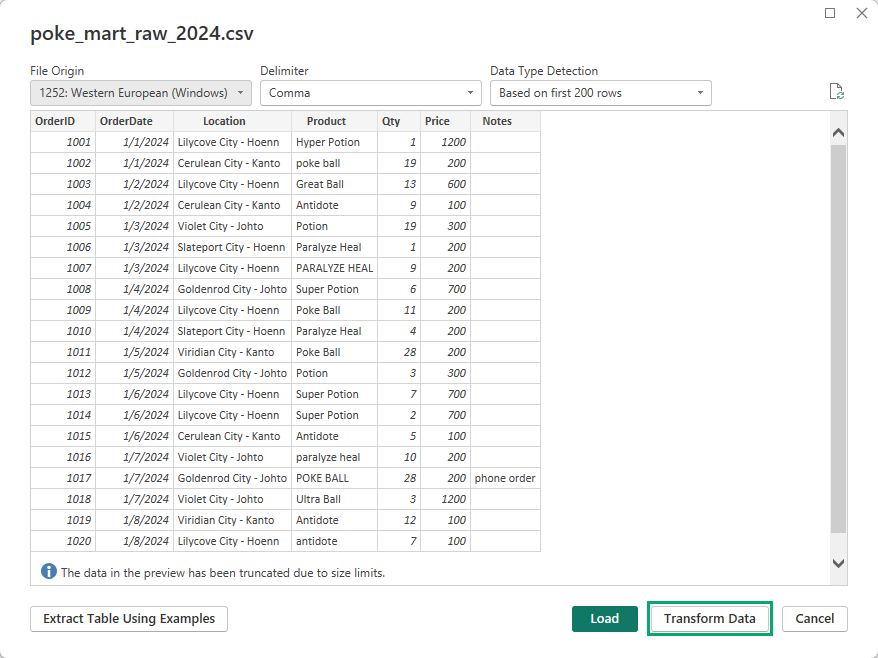
Load would load the data as it is, mess included.
Transform Data opens the Power Query Editor first, in its own window.
Power Query creates a query for the file and names it after the file: poke_mart_raw_2024.
A query is a list of steps that gets data and shapes it.
The settings in the preview window are explained in Excel and CSV.
To open the editor again later, select Transform data on the Home tab of the main Power BI Desktop window.
A Tour of the Editor
This is the Power Query Editor with the Poke Mart query open:
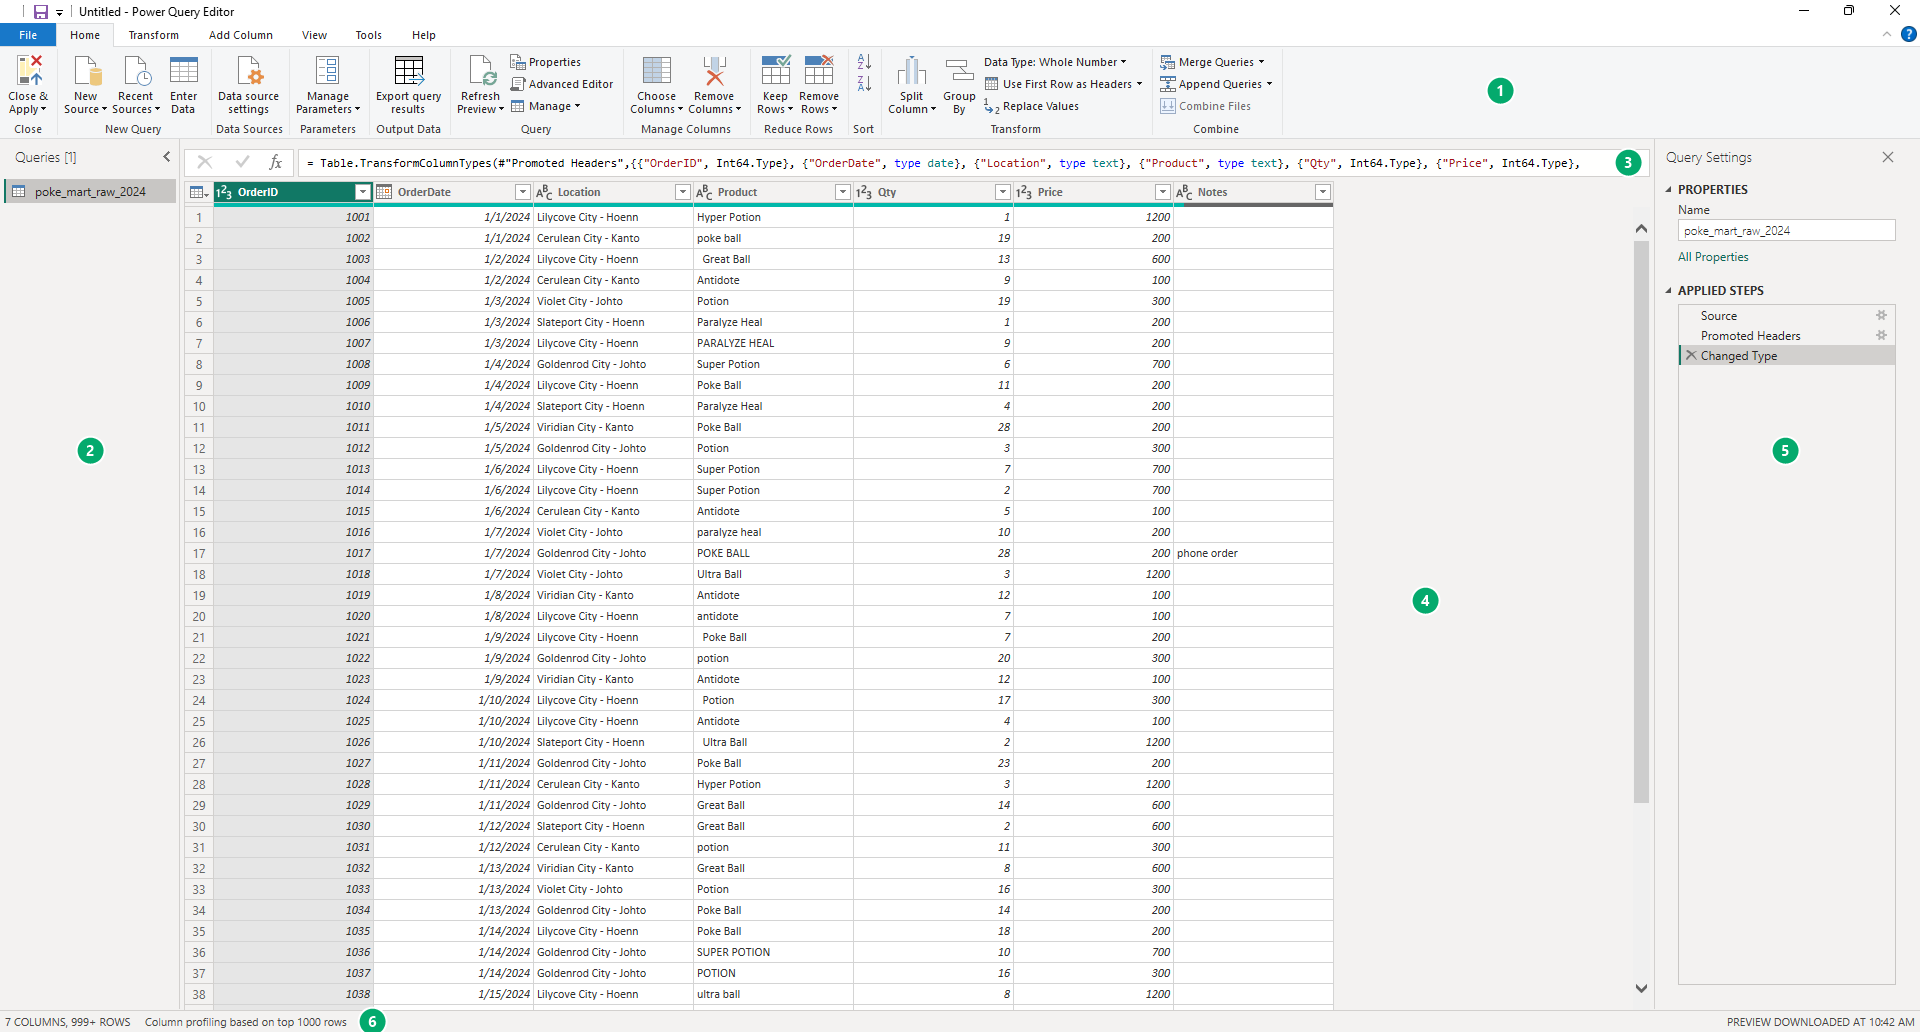
- Ribbon: tabs with all the transformations.
- Queries pane: all the queries in your file. Right now there is one, poke_mart_raw_2024.
- Formula bar: the formula of the selected step.
- Data preview: the data of the selected query, as it looks after the selected step.
- Query Settings pane: the name of the query, and the list of Applied Steps.
- Status bar: the number of columns and rows, and what the column profiles are based on.
The Ribbon
The ribbon of the Power Query Editor is not the same as the ribbon of the main window.
These are the four tabs you will use most:
| Tab | What you find there |
|---|---|
| Home | Close & Apply, New Source, Remove Columns, Keep Rows and Remove Rows, Data Type, Replace Values, Merge Queries and Append Queries |
| Transform | Commands that change existing columns: Data Type, Rename, Replace Values, Split Column, Format, Fill, Unpivot Columns |
| Add Column | Commands that add new columns: Custom Column, Conditional Column, Index Column, Merge Columns |
| View | Show or hide the formula bar and the Query Settings pane, turn on column profiling, and open the Advanced Editor |
There are also a Tools tab and a Help tab, and the File menu.
Some commands are on more than one tab, and many are also in the menu you get when you right-click a column header.
The Data Preview
The data preview shows the top rows of the query.
After the automatic steps, the first rows look like this:
| 123OrderID | DATEOrderDate | ABCLocation | ABCProduct | 123Qty | 123Price | ABCNotes |
|---|---|---|---|---|---|---|
| 1001 | 1/1/2024 | Lilycove City - Hoenn | Hyper Potion | 1 | 1200 | |
| 1002 | 1/1/2024 | Cerulean City - Kanto | poke ball | 19 | 200 | |
| 1003 | 1/2/2024 | Lilycove City - Hoenn | Great Ball | 13 | 600 | |
| 1004 | 1/2/2024 | Cerulean City - Kanto | Antidote | 9 | 100 | |
| 1005 | 1/3/2024 | Violet City - Johto | Potion | 19 | 300 | |
| 1006 | 1/3/2024 | Slateport City - Hoenn | Paralyze Heal | 1 | 200 | |
| 1007 | 1/3/2024 | Lilycove City - Hoenn | PARALYZE HEAL | 9 | 200 | |
| 1008 | 1/4/2024 | Goldenrod City - Johto | Super Potion | 6 | 700 | |
| ... | ... | ... | ... | ... | ... | ... |
The query has 1,285 rows.
The preview shows only the top of it, so you can see the effect of each step quickly.
That is also why the status bar says 7 COLUMNS, 999+ ROWS: it counts the preview, not the whole query.
Each column header has two small controls:
- On the left, an icon for the data type. On this page, ABC means text, 123 means whole number, and DATE stands for the calendar icon of a date column. You learn all the types in Data Types.
- On the right, an arrow that opens a menu to sort and filter the column.
Power Query shows dates in the date format of your computer.
In the file, the first date is written 2024-01-01.
You can already see some of the mess: poke ball in lowercase, PARALYZE HEAL in uppercase, and Great Ball with extra spaces around it.
Column Profiling
Power Query can also tell you about the quality of each column.
On the View tab, in the Data Preview group, select these two check boxes:
- Column quality: the percentage of Valid, Error and Empty values, under each header.
- Column distribution: a small chart of how often each value appears, with the number of distinct and unique values.
The third check box, Column profile, adds statistics and a value chart for the selected column in a pane below the preview.
Try it, then clear it again so the preview keeps its space.
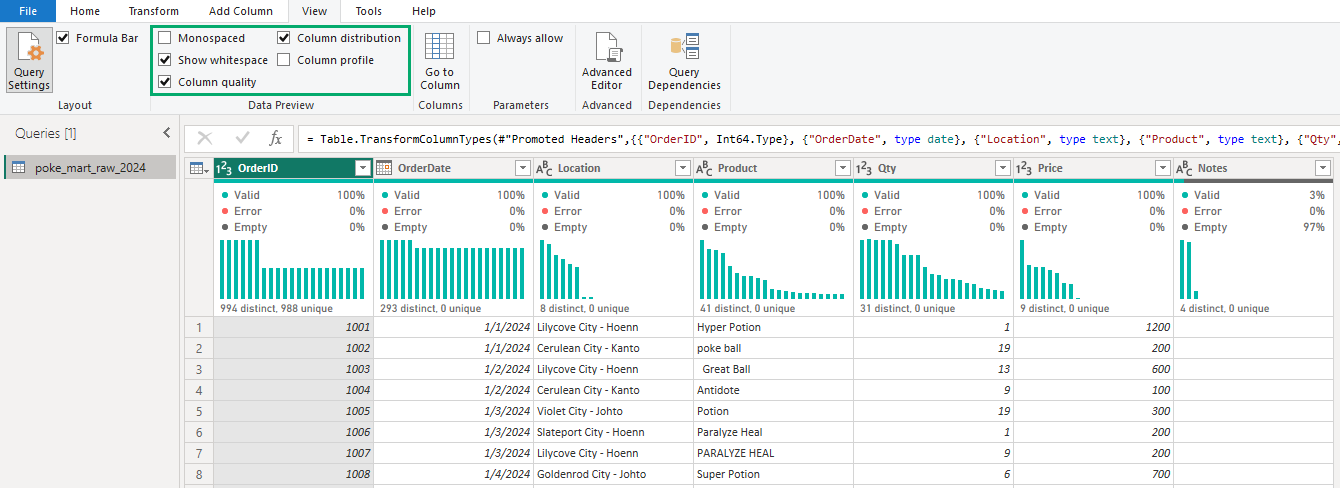
Turn on Column quality and look at Notes: most of it is empty.
In the next chapter you remove that column.
Note: By default, column profiling looks only at the top 1000 rows.
The status bar says so: Column profiling based on top 1000 rows.
You learn how to change that in Filter Rows.
Query Settings and Applied Steps
The Query Settings pane on the right has two parts.
Under Properties you can change the name of the query.
Under Applied Steps you see every step of the query, in order.
You have not changed anything yet, but the query already has three steps.
Power Query added them for you:
| Step | What it does |
|---|---|
| Source | Reads the CSV file. The columns are called Column1 to Column7, and the column names are still in the first row. |
| Promoted Headers | Uses the first row as the column names. |
| Changed Type | Sets a data type for each column, based on the values in the first 200 rows. |
Select a step to see the data as it was right after that step.
Select Source, and the headers change to Column1, Column2 and so on.
Select Changed Type to go back to the end.
Note: Always select the last step before you make a change.
A new step is added after the selected step.
If you select an earlier step, the new step goes into the middle of the query, and Power Query asks you to confirm.
You can also rename, move and delete steps.
That is covered in Steps and M.
The Formula Bar
Every step is a formula in the M language, the language of Power Query.
Select the Changed Type step, and the formula bar shows something similar to this:
= Table.TransformColumnTypes(#"Promoted Headers",{{"OrderID", Int64.Type}, {"OrderDate", type date}, {"Location", type text}, {"Product", type text}, {"Qty", Int64.Type}, {"Price", Int64.Type}, {"Notes", type text}})
You can read it: take the table from the step Promoted Headers, and give each column a type.
You do not have to write M. The buttons write it for you.
If you do not see the formula bar, select View > Formula Bar.
Close & Apply
The steps you make in Power Query do not reach your report until you apply them.
On the Home tab, the first button is Close & Apply.
Its dropdown arrow has three choices:
| Command | What it does |
|---|---|
| Close & Apply | Runs all the steps, loads the result into Power BI Desktop, and closes the editor |
| Apply | Runs the steps and loads the result, but keeps the editor open |
| Close | Closes the editor without loading. Your steps are kept, but not yet applied |
Select Close & Apply now.
Power BI Desktop loads the data, and a table called poke_mart_raw_2024 appears in the Data pane.
It still holds all 1,285 rows, mess included.
Save your report as pq_cleanup.pbix: select File > Save as, then Browse this device.
(File > Save is grayed out until a new report has been saved once.)
The rest of this chapter is one continuous cleanup.
Each page starts from pq_cleanup.pbix as the page before it left it: you open the file, open the editor again with Transform data, and continue where you stopped.
At the end of each page, select Close & Apply and save the file again with File > Save.
What You Learned
- Power Query cleans and shapes data before it is loaded, and repeats the steps on every refresh.
- Transform Data opens the Power Query Editor instead of loading the data directly.
- The editor has a ribbon, a Queries pane, a formula bar, a data preview, the Query Settings pane and a status bar.
- A CSV query starts with three automatic steps: Source, Promoted Headers and Changed Type.
- Close & Apply loads the result into your report.







