
Power BI Scatter Chart
What Is a Scatter Chart?
A scatter chart places each item as a dot, using two numbers: one for the horizontal position (x) and one for the vertical position (y).
It shows how two measures relate to each other.
For example: do the products that sell the most units also have the best margin?
When a third number sets the size of each dot, the scatter chart becomes a bubble chart.
In this chapter you plot the ten Poke Mart products.
Work in your file from the DAX chapter, for example poke_mart_dax.pbix (see Power BI Visuals for what it holds), and use these measures from DAX Aggregations, DAX DIVIDE and DAX Measures:
- x (left to right): Units Sold
- y (bottom to top): Margin %
- Bubble size: Total Sales
Create a Scatter Chart
- Click an empty spot on the canvas and select Scatter chart in the Visualizations pane.
- Drag Product from the Products table to the Values well.
- Drag Units Sold to the X Axis well.
- Drag Margin % to the Y Axis well.
The Values well decides what one dot stands for.
Here, one dot is one product.
If you leave Values empty, Power BI adds everything up into a single dot: 24,488 units at 45.58%.
That dot tells you nothing, so always fill the Values well.
The chart shows ten dots:
| Product | Units Sold (x) | Margin % (y) |
|---|---|---|
| Poke Ball | 9,108 | 45.00% |
| Potion | 5,090 | 50.00% |
| Great Ball | 2,796 | 45.00% |
| Super Potion | 2,208 | 45.71% |
| Antidote | 1,799 | 55.00% |
| Paralyze Heal | 978 | 52.50% |
| Ultra Ball | 790 | 41.67% |
| Awakening | 722 | 52.00% |
| Hyper Potion | 515 | 43.33% |
| Revive | 482 | 40.00% |
Why is the margin such a round number for each product?
Every product always sells at the same price and costs the same, so its Margin % is simply (UnitPrice - UnitCost) / UnitPrice.
For a Poke Ball: (200 - 110) / 200 = 45%.
Make It a Bubble Chart
- With the scatter chart selected, drag Total Sales to the Size well.
- Optional: drag Category to the Legend well, so each category gets its own color.
Each dot becomes a bubble.
The bigger the bubble, the more money the product brought in:
| Product | Category | Units Sold | Margin % | Total Sales (size) |
|---|---|---|---|---|
| Poke Ball | Balls | 9,108 | 45.00% | 1,821,600 |
| Great Ball | Balls | 2,796 | 45.00% | 1,677,600 |
| Super Potion | Medicine | 2,208 | 45.71% | 1,545,600 |
| Potion | Medicine | 5,090 | 50.00% | 1,527,000 |
| Ultra Ball | Balls | 790 | 41.67% | 948,000 |
| Revive | Medicine | 482 | 40.00% | 723,000 |
| Hyper Potion | Medicine | 515 | 43.33% | 618,000 |
| Paralyze Heal | Status Healers | 978 | 52.50% | 195,600 |
| Awakening | Status Healers | 722 | 52.00% | 180,500 |
| Antidote | Status Healers | 1,799 | 55.00% | 179,900 |
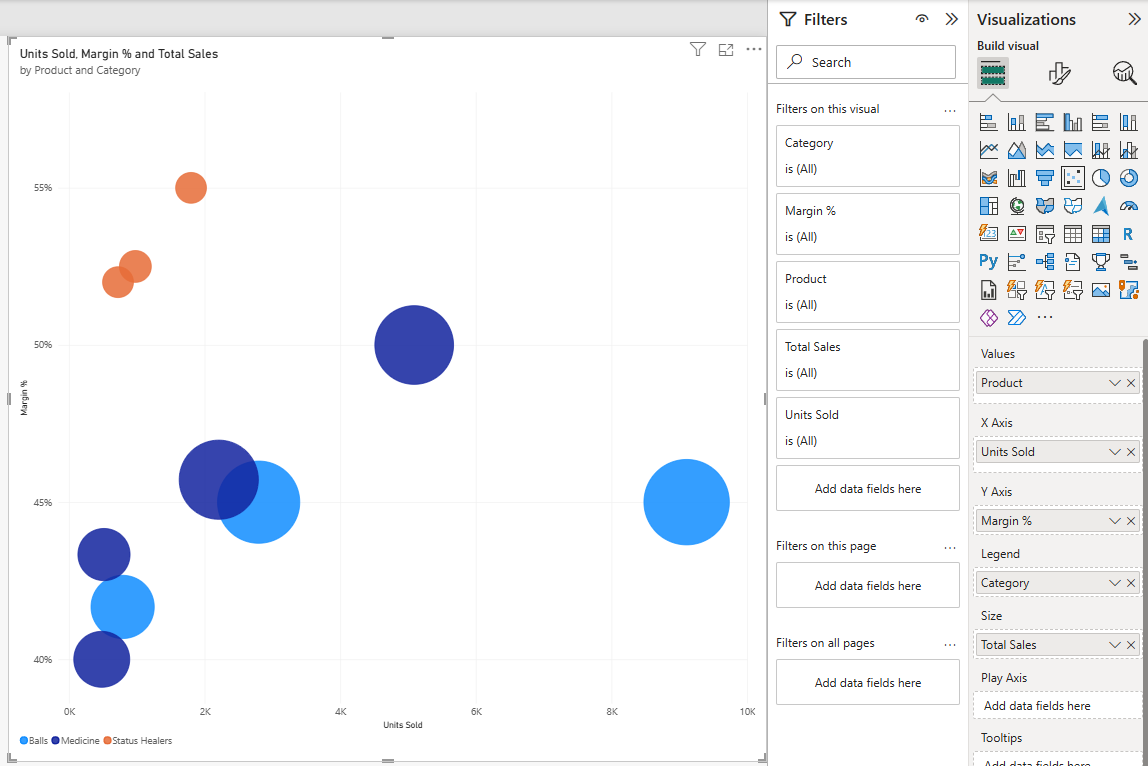
Poke Ball has the biggest bubble, far to the right.
Antidote has the smallest bubble, even though it sold more units than five other products: one Antidote sells for only 100.
Read the Quadrants
Two reference lines split the chart into four areas, called quadrants.
Add them in the Analytics pane:
- With the chart selected, select the Analytics icon in the Visualizations pane.
- Expand X-Axis Constant Line, select + Add line, and type 2449 in the Value box. This is the average number of units per product: 24,488 units / 10 products = 2,448.8.
- Expand Y-Axis Constant Line, select + Add line, and type 0.4558 in the Value box. This is the margin of the whole shop, 45.58%. Enter it as a decimal, because that is the real value of the measure. Only one section stays expanded at a time, so the X-Axis section closes, but its line stays on the chart.
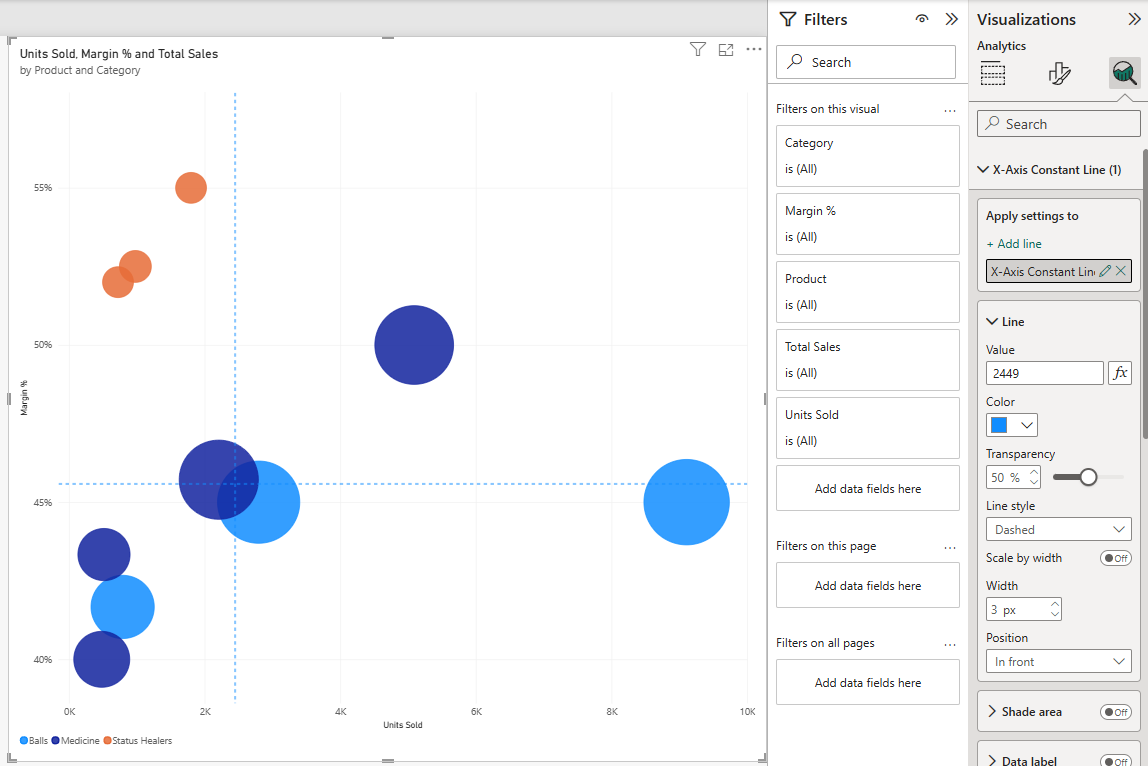
Now each product falls into one quadrant:
| Quadrant | Products | What it means |
|---|---|---|
| Top right: many units, high margin | Potion | The best place to be. Potion sells a lot and keeps half of every sale as profit. |
| Bottom right: many units, lower margin | Poke Ball, Great Ball | The volume sellers. They bring in a lot of money, at a margin just below the shop's average. |
| Top left: few units, high margin | Super Potion, Antidote, Paralyze Heal, Awakening | Selling more of these would raise the margin of the whole shop. |
| Bottom left: few units, lower margin | Ultra Ball, Hyper Potion, Revive | The products to look at more closely. |
The bubble sizes add a warning to the bottom left quadrant.
Those three products are expensive, so their bubbles are not small.
Ultra Ball brings in 948,000 from only 790 units, more than all three Status Healers together (556,000).
Points close to a line are borderline.
Super Potion sits just left of the units line (2,208 units) and just above the margin line (45.71%).
Animate With the Play Axis
A scatter chart can also show change over time.
Drag Year from the Date table to the Play Axis well.
A play button appears under the chart.
Select it, and the bubbles move from their 2024 position to their 2025 position.
In the Poke Mart data, the bubbles only move left or right.
Prices and costs did not change, so each product has the same Margin % in both years. Only the units change:
| Product | Units Sold 2024 | Units Sold 2025 |
|---|---|---|
| Poke Ball | 4,016 | 5,092 |
| Potion | 2,118 | 2,972 |
| Great Ball | 1,396 | 1,400 |
| Super Potion | 1,046 | 1,162 |
| Antidote | 961 | 838 |
| Paralyze Heal | 563 | 415 |
| Ultra Ball | 369 | 421 |
| Awakening | 328 | 394 |
| Hyper Potion | 229 | 286 |
| Revive | 251 | 231 |
Poke Ball moves furthest to the right (1,076 more units), followed by Potion (854 more).
Antidote, Paralyze Heal and Revive move to the left: they sold fewer units in 2025 than in 2024.
Note: With a field in the Play Axis well, the chart shows one year at a time.
Remove Year from the well when you are done, so the bubbles show both years together again.
Tip: Scatter charts are easiest to read when the visual is about as wide as it is tall.







