
Power BI First Report
Build a Report in 10 Minutes
In this chapter you build a complete one-page report from the Poke Mart sales data.
The report has four visuals:
- A card with the total sales
- A column chart of sales by category
- A slicer to filter the page by region
- A line chart of sales over time
You need Power BI Desktop (see Get Started) and the practice file:
After each step, compare your numbers with the table in that step.
Step 1: Load the Data
- Open Power BI Desktop and start a blank report.
- On the Home tab, select Get data > Excel workbook.
- The first time, a pop-up named Introducing the new Get Data experience! may appear. Select No thanks.
- Find poke_mart_sales.xlsx and select Open.
- The Navigator window opens. Select the check box next to Sales. A preview of the data appears on the right.
- Select Load.
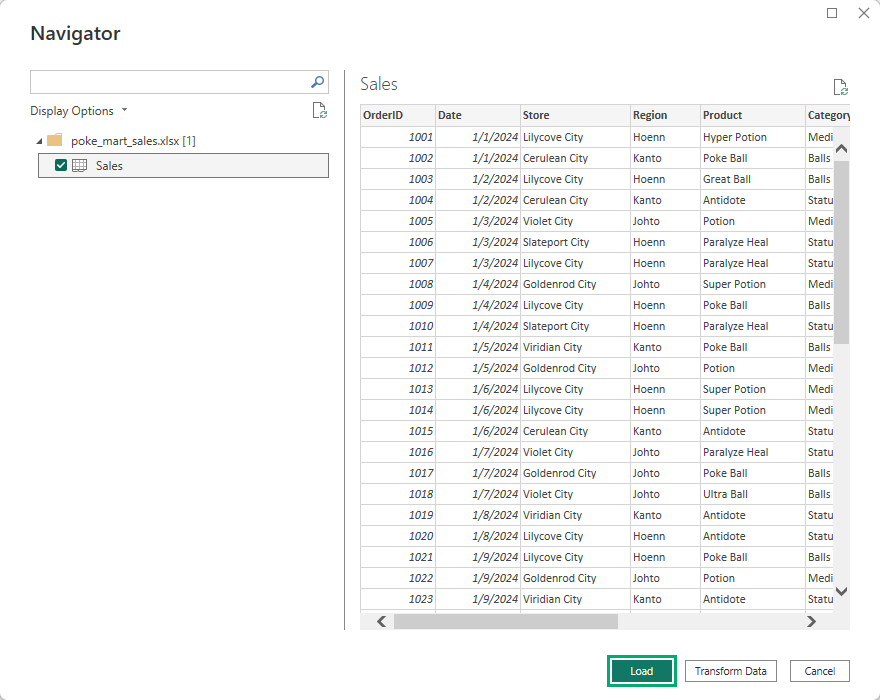
Power BI loads all 2,740 rows.
A table called Sales appears in the Data pane on the right.
Expand it to see its ten columns.
The Transform Data button in the Navigator opens the Power Query Editor, where you can clean the data before loading it.
The Poke Mart data is already clean, so Load is enough.
Note: In the Data pane, OrderID has a sigma sign (Σ).
Power BI sees that the column holds numbers, so it plans to summarize them in visuals.
For OrderID it counts them by default.
But an order number is a label, not an amount, so it should not be summarized at all: adding up all the OrderIDs, for example, gives 6,495,170, which tells you nothing about the shop.
You will fix this in the data modeling chapter.
For now, do not use OrderID in a visual.
Step 2: Add a Card with Total Sales
A card shows one big number.
It is often the first thing people look at in a report.
- Click an empty spot on the canvas, so no visual is selected.
- In the Visualizations pane, select the Card visual.
- In the Data pane, select the check box next to Sales.
- Drag the card to the top left of the canvas.
The card shows Sum of Sales, the total of the Sales column.
| Visual | Expected value |
|---|---|
| Sum of Sales | 9,416,800 |
Power BI shortens big numbers on a card, so the total is shown in millions, with an M, for example 9M.
The table above has the exact value to compare with.
A card is for a quick look; when you need the exact number, use a table.
Step 3: Add a Column Chart of Sales by Category
- Click an empty spot on the canvas.
- In the Visualizations pane, select Clustered column chart.
- In the Data pane, select Category, then Sales.
- Resize the chart and place it next to the card.
Power BI puts Category in the X-axis well and Sum of Sales in the Y-axis well.
You get one column for each category:
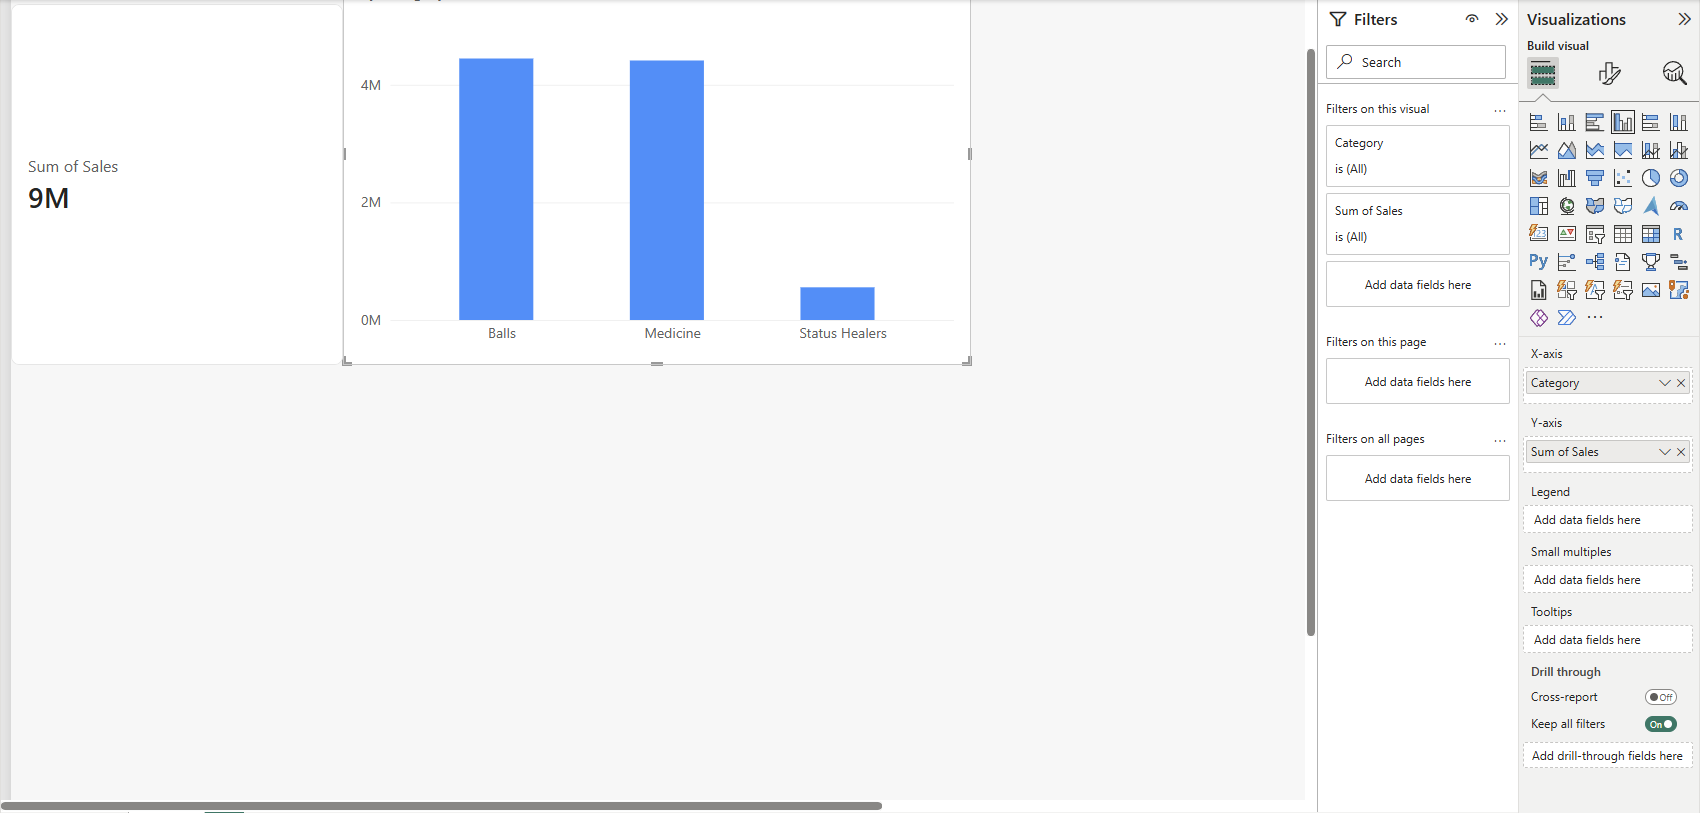
Point to a column to see its exact value in a tooltip.
The tooltip shows the number without thousands separators, for example 4447200 for Balls:
| Category | Sum of Sales |
|---|---|
| Balls | 4,447,200 |
| Medicine | 4,413,600 |
| Status Healers | 556,000 |
Balls and Medicine sell almost the same.
Status Healers are a small part of the business.
This is just like a PivotTable in Excel with Category in Rows and Sum of Sales in Values, only drawn as a chart.
Step 4: Add a Slicer on Region
A slicer is a filter that sits on the canvas, where readers can see and use it.
- Click an empty spot on the canvas.
- In the Visualizations pane, select Slicer.
- In the Data pane, select Region.
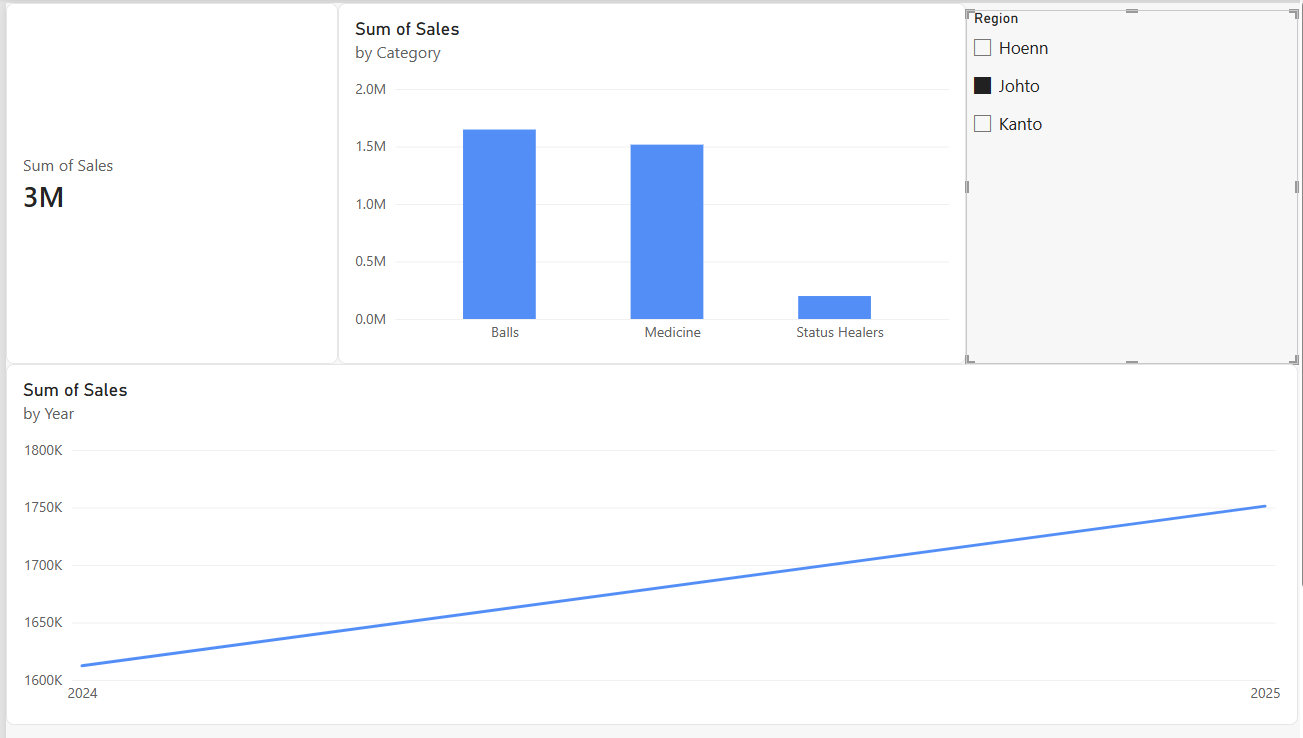
- The slicer shows the three regions as a list, with a check box for each region.
- In the slicer, select Johto.
Every visual on the page now shows Johto only.
The card and the column chart change at once.
The card shows the total shortened, for example 3M:
| Johto only | Sum of Sales |
|---|---|
| Total (card) | 3,363,650 |
| Balls | 1,647,600 |
| Medicine | 1,516,300 |
| Status Healers | 199,750 |
This is what makes Power BI different from a chart in a spreadsheet: all the visuals on a page are connected.
Clicking a column in the column chart filters or highlights the other visuals too.
To select more than one region, hold Ctrl while you click.
To remove the filter, select Johto again.
Step 5: Add a Line Chart of Sales by Date
First, select Johto in the slicer again, so the page shows all regions.
- Click an empty spot on the canvas.
- In the Visualizations pane, select Line chart.
- In the Data pane, select Date, then Sales.
- Make the chart wide, below the other visuals.
Look at the X-axis well.
Power BI did not add just the Date column.
It added a date hierarchy with four levels: Year, Quarter, Month and Day.
Power BI builds this hierarchy for every date column automatically.
The chart starts at the top level, so it shows one point per year:
| Year | Sum of Sales |
|---|---|
| 2024 | 4,393,200 |
| 2025 | 5,023,600 |
Sales grew from 2024 to 2025. To see more detail, point to the chart and use the drill arrows at the top or bottom of the visual.
Select Expand all down one level in the hierarchy to show each quarter of each year:
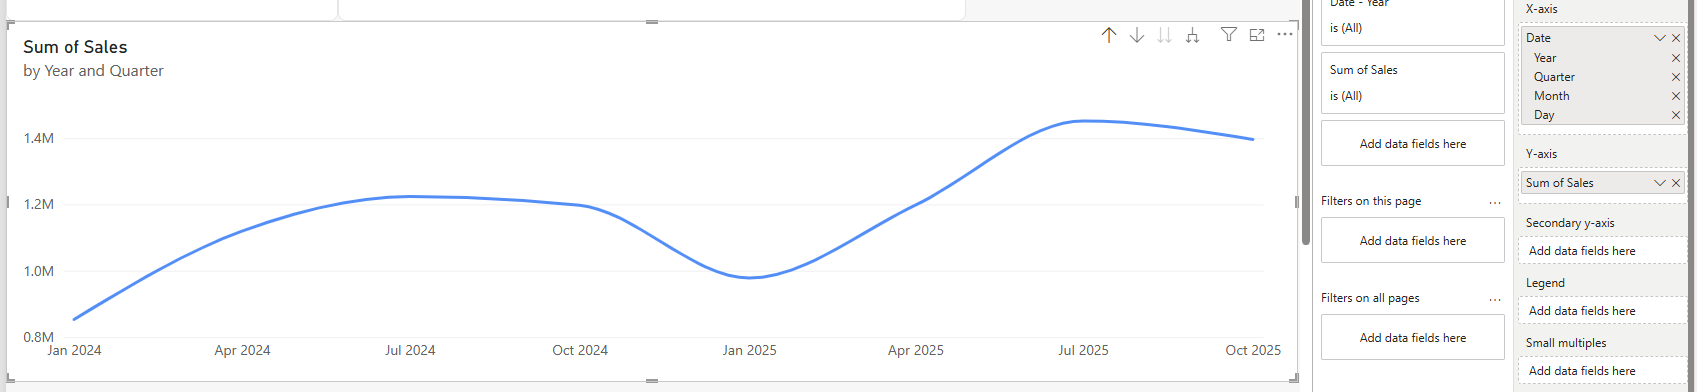
| Year | Quarter | Sum of Sales |
|---|---|---|
| 2024 | Qtr 1 | 852,950 |
| 2024 | Qtr 2 | 1,119,400 |
| 2024 | Qtr 3 | 1,223,600 |
| 2024 | Qtr 4 | 1,197,250 |
| 2025 | Qtr 1 | 977,950 |
| 2025 | Qtr 2 | 1,197,800 |
| 2025 | Qtr 3 | 1,452,100 |
| 2025 | Qtr 4 | 1,395,750 |
Select Drill up to go back to years.
Now try the slicer again: select Johto, and the line chart shows Johto only (1,612,450 in 2024 and 1,751,200 in 2025).
Step 6: Save Your Report
- Select File > Save as. On a new report that was never saved, Save is grayed out.
- The Save a copy page opens. Under Other, select Browse this device.
- The Windows Save As dialog opens. Choose a folder, and name the file poke_mart_report.
- Select Save.
Power BI Desktop saves the report as a .pbix file.
The file holds everything: the data, the model and the report pages.
You can close Power BI Desktop and open the file again later.
Your finished report should look like this, here with Johto selected:
Good job! You have built your first interactive Power BI report.
What You Learned
- Get data > Excel workbook and the Navigator load a sheet into Power BI.
- Power BI summarizes number columns automatically, even ID columns where that makes no sense.
- A card shows one number, and a column chart compares categories.
- A slicer filters every visual on the page.
- Date columns get a Year, Quarter, Month and Day hierarchy that you can drill into.
In the next chapters you will clean data with Power Query, build a data model with relationships and DAX measures, and publish your report to the Power BI service.







