
Power BI Line and Area Charts
Line Charts Show Trends
A line chart connects values with a line.
It is the best way to show how a value changes over time: rising, falling, or repeating every year.
Power BI has four visuals in the line family:
- Line chart
- Area chart
- Stacked area chart
- 100% Stacked area chart
Two combo charts mix lines with columns: Line and stacked column chart and Line and clustered column chart.
In the First Report chapter, the line chart used the date hierarchy that Power BI makes automatically.
Your model now has its own Date table, with the hierarchy Year > Quarter > Month that you built in the Hierarchies chapter.
This page uses that hierarchy.
Work in your file from the DAX chapter, for example poke_mart_dax.pbix (see Power BI Visuals for what it holds).
The page uses the measures Total Sales, Sales LY, Sales YoY % and Margin %.
Total Sales by Month
Build a line chart of Total Sales for each month of 2025:
- Click an empty spot on the canvas.
- In the Visualizations pane, select Line chart.
- In the Data pane, expand the Date table and drag Year Hierarchy (Year > Quarter > Month) to the X-axis well. All three levels are added.
- Expand Sales and select Total Sales. It goes to the Y-axis well.
The chart starts at the top level of the hierarchy, so it shows only two points: 2024 and 2025. Keep only 2025 with a filter on this visual:
- In the Filters pane, find Filters on this visual. Because the hierarchy is on the axis, it already has a filter card for Year, and for Quarter and Month. Expand the Year card.
- The card opens as Advanced filtering. Set Filter type to Basic filtering and select 2025.
- Point to the chart, and select Go to the next level in the hierarchy (the double down arrow) twice: from Year to Quarter, then from Quarter to Month.
The chart now has twelve points, Jan to Dec 2025. The months are in calendar order, because the Month column is sorted by Month Number.
| Month (2025) | Total Sales |
|---|---|
| Jan | 317,300 |
| Feb | 289,900 |
| Mar | 370,750 |
| Apr | 359,450 |
| May | 414,500 |
| Jun | 423,850 |
| Jul | 510,200 |
| Aug | 585,600 |
| Sep | 356,300 |
| Oct | 363,250 |
| Nov | 398,500 |
| Dec | 634,000 |
The twelve months add up to 5,023,600, the Total Sales for 2025. The line rises to a summer peak in August, drops in September, and ends with the best month of the year, December.
Note: Do not skip the Year filter.
Go to the next level in the hierarchy shows all months without their year, so without the filter, each month adds up both years.
January would show 607,900: 290,600 from 2024 plus 317,300 from 2025.
This Year vs Last Year
One line shows the trend.
Two lines let you compare.
Add last year's sales to the same chart:
- With the line chart selected, select Sales LY in the Data pane. It goes to the Y-axis well, below Total Sales.
- Drag Sales YoY % to the Tooltips well. It is not drawn, but it appears when you point to a month.
Sales LY is the measure from the Time Intelligence chapter:
Example
Sales LY = CALCULATE([Total Sales], SAMEPERIODLASTYEAR('Date'[Date]))
The visual is filtered to 2025, but Sales LY still works: for each month of 2025, it returns the same month of 2024.
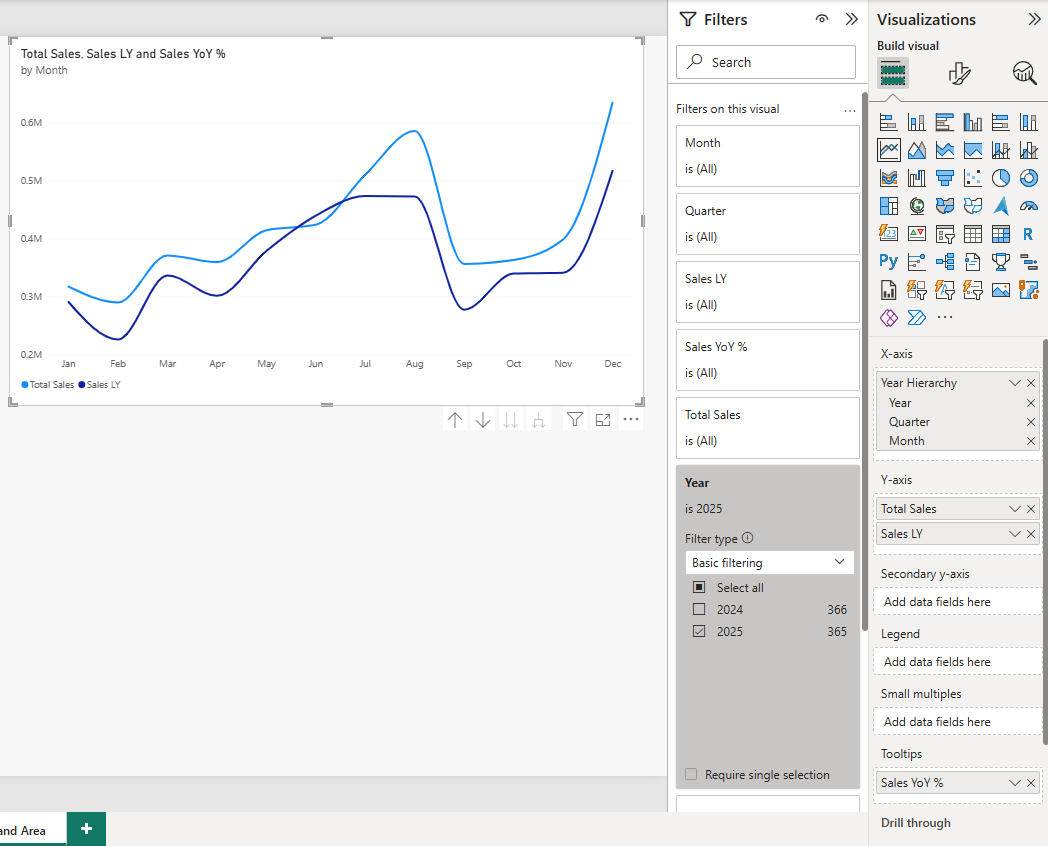
Point to each month to check your chart:
| Month (2025) | Total Sales | Sales LY | Sales YoY % |
|---|---|---|---|
| Jan | 317,300 | 290,600 | 9.19% |
| Feb | 289,900 | 226,000 | 28.27% |
| Mar | 370,750 | 336,350 | 10.23% |
| Apr | 359,450 | 301,300 | 19.30% |
| May | 414,500 | 378,600 | 9.48% |
| Jun | 423,850 | 439,500 | -3.56% |
| Jul | 510,200 | 473,500 | 7.75% |
| Aug | 585,600 | 472,700 | 23.88% |
| Sep | 356,300 | 277,400 | 28.44% |
| Oct | 363,250 | 339,650 | 6.95% |
| Nov | 398,500 | 341,050 | 16.85% |
| Dec | 634,000 | 516,550 | 22.74% |
The Total Sales line is above the Sales LY line in every month but one.
June 2025 sold 3.56% less than June 2024. Over the whole year, sales grew 14.35%, from 4,393,200 to 5,023,600.
The two lines follow the same shape: both years peak in summer and in December.
A pattern that repeats every year is called seasonality.
To make the lines easier to tell apart, make last year dashed: select Format visual, open the Visual tab, expand Lines, select Sales LY in Apply settings to, and set Line style to Dashed.
Note: A chart with two or more measures in the Y-axis well cannot also have a field in the Legend well.
Use either several measures or one measure split by a Legend.
Area and Stacked Area Charts
An area chart is a line chart with the space below the line filled in.
The filled area puts the focus on how big the values are, not only on which way they move.
Show the 2025 sales of each product category as areas:
- Select the line chart, and copy and paste it (Ctrl+C, Ctrl+V). Select the copy and check two things: the Filters pane still shows the Year filter set to 2025, and the chart still shows months. If it shows years again, go down to the Month level as before.
- In the copy, remove Sales LY and Sales YoY % from the wells (select the X next to each).
- In the Visualizations pane, select Area chart.
- Drag Products > Category to the Legend well.
The chart draws one area per category.
All three start from zero and lie on top of each other, and Power BI makes them see-through so you can see where they overlap.
This is also called a layered area chart.
- With the chart selected, select Stacked area chart.
Now the areas are stacked on top of each other, in the order of the legend.
The top edge of the stack is the total for all categories, the same line as Total Sales in the first chart.
Here are the two versions side by side.
To compare them on your own page, paste a second copy before you switch it to Stacked area chart:
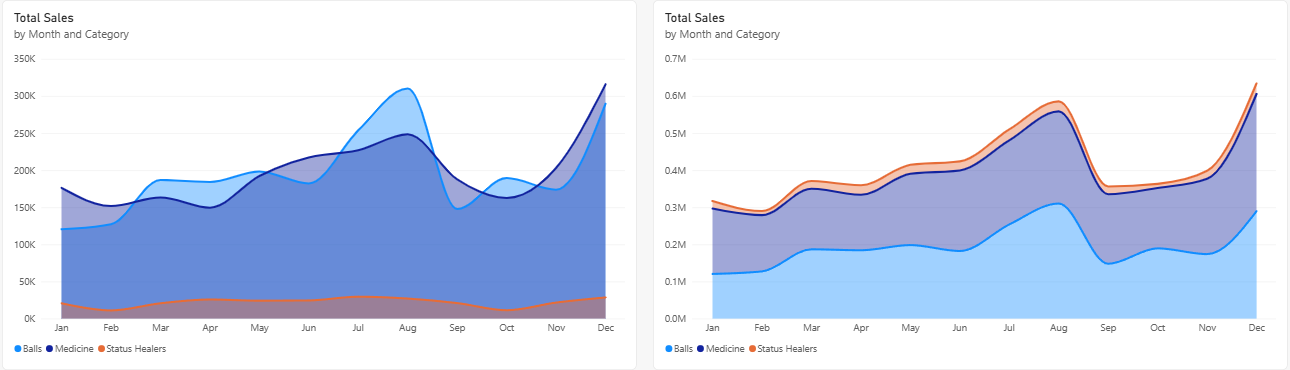
Both charts use these values:
| Month (2025) | Balls | Medicine | Status Healers | Total |
|---|---|---|---|---|
| Jan | 120,400 | 176,300 | 20,600 | 317,300 |
| Feb | 127,200 | 151,700 | 11,000 | 289,900 |
| Mar | 186,800 | 163,300 | 20,650 | 370,750 |
| Apr | 184,200 | 149,500 | 25,750 | 359,450 |
| May | 198,200 | 192,200 | 24,100 | 414,500 |
| Jun | 182,200 | 217,200 | 24,450 | 423,850 |
| Jul | 253,800 | 226,900 | 29,500 | 510,200 |
| Aug | 310,200 | 248,400 | 27,000 | 585,600 |
| Sep | 147,800 | 187,600 | 20,900 | 356,300 |
| Oct | 189,400 | 162,600 | 11,250 | 363,250 |
| Nov | 173,800 | 203,100 | 21,600 | 398,500 |
| Dec | 289,600 | 315,900 | 28,500 | 634,000 |
Balls and Medicine take turns being the bigger category, so in the layered chart their areas keep crossing and hiding each other.
The stacked chart gives each category its own band, and shows the total too.
Microsoft recommends layered area charts for two or three areas at most.
With more, use a line chart or a stacked area chart.
The 100% Stacked area chart stretches every month to 100%, so it shows each category's share of the month, like the 100% stacked column chart in Bar and Column Charts.
Line and Clustered Column Chart
Sometimes you want two measures with very different scales in one chart.
Total Sales is in the hundreds of thousands each month.
Margin % is about 45%, a number below 1. On a shared axis, Margin % would be a flat line along the bottom.
A combo chart solves this with two value axes: columns on the left axis, a line on the right axis.
- Copy and paste the first line chart again, and remove Sales LY and Sales YoY % from the copy. As before, check that the copy shows the months of 2025.
- Select Line and clustered column chart.
- Total Sales moves to the Column y-axis well by itself. Check that it is there.
- Drag Margin % to the Line y-axis well.
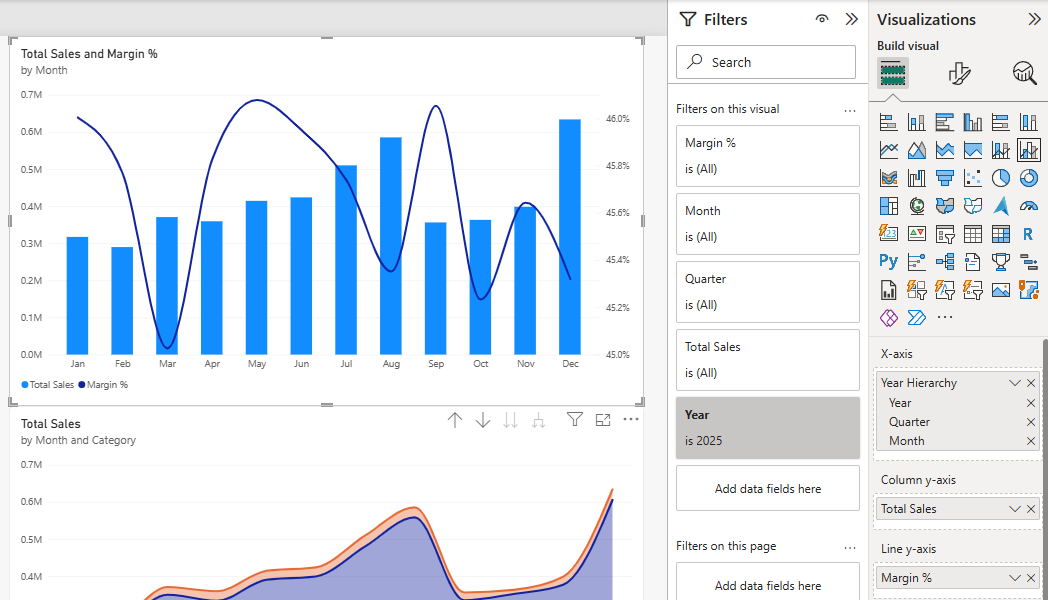
Total Sales is drawn as columns, and Margin % as a line.
Because the two measures have such different ranges, Power BI gives the line its own axis on the right, the secondary y-axis.
| Month (2025) | Total Sales | Margin % |
|---|---|---|
| Jan | 317,300 | 46.00% |
| Feb | 289,900 | 45.77% |
| Mar | 370,750 | 45.03% |
| Apr | 359,450 | 45.83% |
| May | 414,500 | 46.08% |
| Jun | 423,850 | 45.95% |
| Jul | 510,200 | 45.74% |
| Aug | 585,600 | 45.35% |
| Sep | 356,300 | 46.05% |
| Oct | 363,250 | 45.23% |
| Nov | 398,500 | 45.64% |
| Dec | 634,000 | 45.32% |
Sales change a lot from month to month, but Margin % stays between 45.03% (March) and 46.08% (May) all year.
The mix of products changes a little each month, and the margin hardly moves.
The line in your chart looks bumpy, because the right axis runs only from 45.0% to 46.0%.
Always check the numbers on the right axis before you draw conclusions.
A two-axis chart can make a small change look big.
The other combo chart, Line and stacked column chart, works the same way, but its columns can be stacked, for example one piece per category.







