
Power BI Get Data
What Is a Data Source?
A data source is the place where your data lives.
It can be a file on your computer, a database on a server, a table on a web page, or an online service.
Power BI connects to the source, reads the data, and usually keeps a copy of it in your report.
Getting data is the first step of every Power BI project, as you saw in the Workflow chapter.
Power BI Desktop can connect to a long list of sources.
They are grouped in categories:
| Category | Examples |
|---|---|
| File | Excel Workbook, Text/CSV, XML, JSON, PDF, Folder |
| Database | SQL Server database, Access database, Oracle database, MySQL database, PostgreSQL database |
| Microsoft Fabric | Power BI semantic models, Dataflows, Lakehouses, Warehouses |
| Online Services | SharePoint Online List, Salesforce Objects, Google Analytics |
| Other | Web, SharePoint list, OData Feed, Blank Query |
Each source you connect to becomes a query.
Each query loads into one table in the Data pane.
The Get data Button
You find Get data on the left of the Home tab.
The button has two parts:
- Select the icon to open the Get Data window, with every source Power BI supports.
- Select the label or its arrow to open a short list of Common data sources.
The short list has the sources most people use, such as Excel workbook, Text/CSV, Web and SQL Server.
Select More... at the bottom of the list to open the Get Data window.
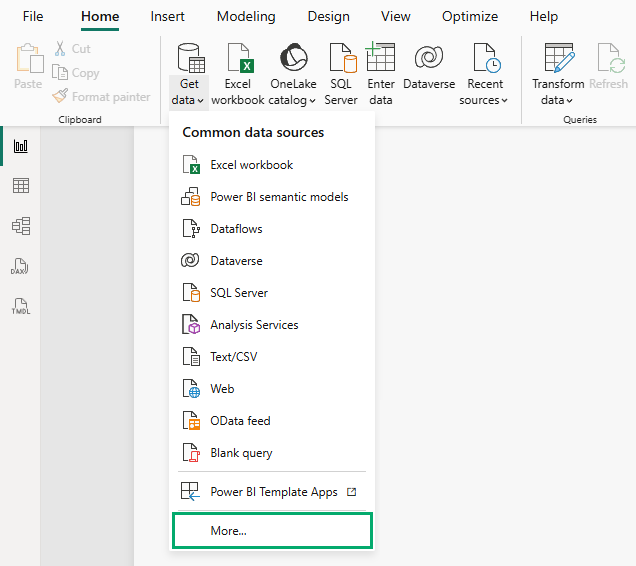
Next to Get data, the Home tab also has shortcut buttons for a few common sources, such as Excel workbook and SQL Server.
Enter data lets you type a small table by hand, and Recent sources lists the sources you used before.
The Get Data Window
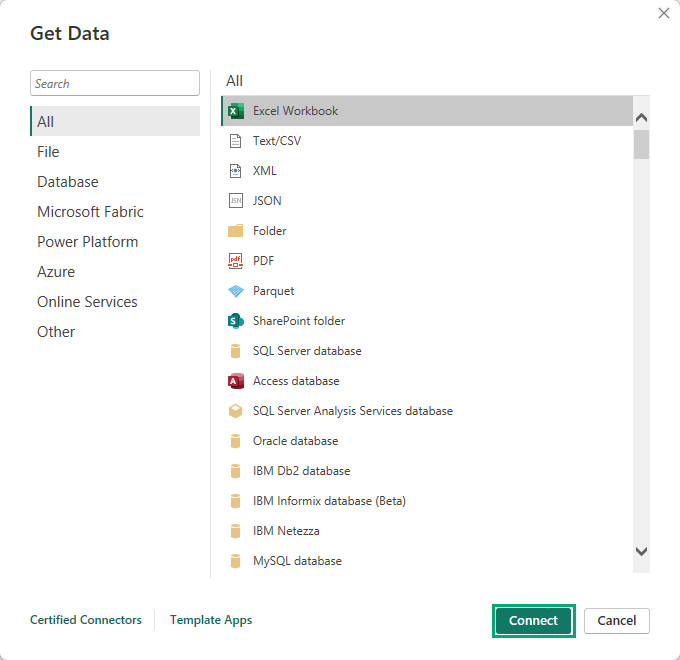
The Get Data window lists the categories on the left: All, File, Database, Microsoft Fabric, Power Platform, Azure, Online Services and Other.
The sources in the selected category are listed on the right.
To connect:
- Select a category, or type the name of the source in the search box.
- Select the source, for example Excel Workbook.
- Select Connect.
What comes next depends on the source.
For a file, Power BI asks you to pick the file.
For a database or a web page, it asks for an address.
The next chapters show each of these.
Some sources are marked (Beta) or (Preview).
They are still being developed, and Microsoft does not recommend them for important reports.
Note: If a pop-up named Introducing the new Get Data experience! appears the first time you pick a source, select No thanks.
If Get data opens a full-page window with sections such as Home, New and Recent data, the preview feature New Power Query experience is turned on.
This tutorial uses the standard Get Data window.
To turn the preview off, go to File > Options and settings > Options > Preview features, clear New Power Query experience, and restart Power BI Desktop.
The Navigator
You met the Navigator in the First Report chapter, when you loaded the Sales sheet.
After Power BI connects to a source, the Navigator shows what the source holds:
- On the left: a list of everything you can load, such as the sheets in a workbook, the tables in a database, or the tables on a web page.
- On the right: a preview of the item you select.
Select the check box next to each item you want.
You can select several items at once.
Each one becomes its own table.
At the bottom of the Navigator are two buttons, Load and Transform Data.
Load or Transform Data?
| Button | What happens | Use it when |
|---|---|---|
| Load | Power BI loads the selected items right away, as they are. They appear as tables in the Data pane. | The data is already clean, like the Sales sheet in poke_mart_sales.xlsx. |
| Transform Data | The Power Query Editor opens. You clean and shape the data first, then select Close & Apply to load it. | The data needs work: columns you do not need, wrong data types, or bad rows. |
In the First Report chapter, Load was enough, because the practice data is clean.
In the Power Query chapter you will load a messy export with Transform Data and clean it step by step.
Choosing Load does not lock you in.
You can open the Power Query Editor at any time later with Transform data on the Home tab.
Several Sources in One Report
A report is not limited to one source.
The Poke Mart could keep its sales in an Excel workbook, publish its price list on a web page, and keep its sales targets in another workbook.
One report can use all three.
To add another source, select Get data again.
Each table you load appears in the Data pane next to the tables you already have.
Tables from different sources can work together in two ways:
- Relationships: in Model view you link tables by a shared column, for example ProductID. See Relationships.
- Combining in Power Query: you add columns from one table to another with Merge Queries, or stack tables with the same columns with Append Queries.
When a query combines data from two sources, Power BI may ask you to set a privacy level for each source, such as Public, Organizational or Private.
Privacy levels stop Power BI from sending private data from one source to another.
To see all the sources a report uses, select File > Options and settings > Data source settings, and choose Data sources in current file.
In This Chapter
The next pages show the most common sources and what happens after you connect:
- Excel and CSV: sheets, Excel tables and named ranges, and the CSV preview options.
- Databases and Web: SQL Server, and the table on a web page.
- Import vs DirectQuery: copy the data, or leave it in the source.
- Refresh Data: get the latest data into your report.







