
Power BI Format Visuals
The Format Visual Pane
Every visual can be formatted: its title, colors, labels, axes and more.
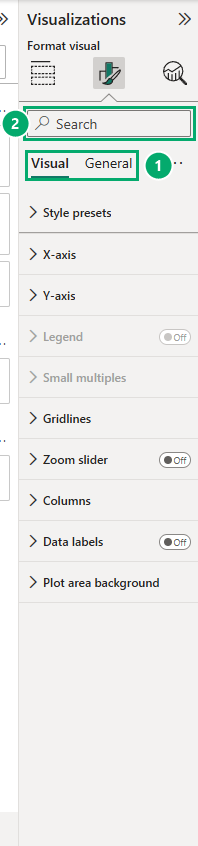
Select a visual, and then select the Format visual icon (the paint brush) in the Visualizations pane.
The pane has two tabs:
| Tab | What it formats | Sections, for example |
|---|---|---|
| Visual | The parts of this type of visual | X-axis, Y-axis, Columns, Data labels, Legend (for a column chart) |
| General | Things almost every visual has | Properties (size and position), Title, Effects (background, border, shadow), Header icons, Tooltips, Alt text |
The sections on the Visual tab change with the visual type.
A pie chart has no X-axis, so it has no X-axis section.
There are many settings.
To find one fast, type its name, for example display units, in the search box at the top of the pane.
The Example: Sales by Store
In this chapter you format a column chart of sales by store, step by step.
Work in your file from the DAX chapter, for example poke_mart_dax.pbix (see Power BI Visuals for what it holds).
The chart uses the measure Total Sales.
- Click an empty spot on the canvas and select Clustered column chart.
- Drag Store from the Stores table to the X-axis well, and Total Sales to the Y-axis well.
- The chart shows the stores from the highest to the lowest sales. If it does not, select More options (...) > Sort by > Total Sales, and then Sort by > Sort descending.
The chart has six columns:
| Store | Total Sales |
|---|---|
| Goldenrod City | 2,280,550 |
| Cerulean City | 1,666,550 |
| Slateport City | 1,598,550 |
| Viridian City | 1,414,600 |
| Lilycove City | 1,373,450 |
| Violet City | 1,083,100 |
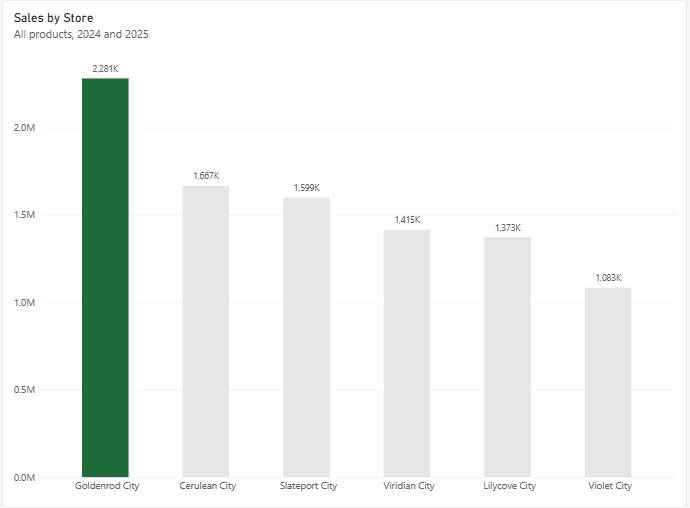
Power BI gives the chart the title Total Sales and an automatic subtitle, by Store.
It is correct, but it can be better.
Title
The title is on the General tab, because every visual has one.
- Select the chart, select Format visual, and select the General tab.
- Expand Title. Under Title, change Text to Sales by Store.
- Subtitle is already on. Under Subtitle, set its Text to All products, 2024 and 2025.
A good title says what the reader sees.
The subtitle says what is included, so nobody has to guess the period.
The same section has settings for the font, size, color and alignment of the title.
Data Labels
Data labels write the value on each column, so readers do not have to read it off the axis.
- On the Visual tab, turn on Data labels.
- Expand Data labels > Value. Set Display units to Thousands and Value decimal places to 0.
Each column now has a short label:
| Store | Total Sales | Data label |
|---|---|---|
| Goldenrod City | 2,280,550 | 2,281K |
| Cerulean City | 1,666,550 | 1,667K |
| Slateport City | 1,598,550 | 1,599K |
| Viridian City | 1,414,600 | 1,415K |
| Lilycove City | 1,373,450 | 1,373K |
| Violet City | 1,083,100 | 1,083K |
The labels are rounded to the nearest thousand: 2,280,550 becomes 2,281K.
Display Units
Display units shorten big numbers.
They appear in many places, for example data labels and axes.
Cards shorten big numbers on their own, with no setting to change.
This is how Goldenrod City's 2,280,550 looks with each setting:
| Display units | Decimal places | Shows |
|---|---|---|
| None | 0 | 2,280,550 |
| Thousands | 0 | 2,281K |
| Millions | 2 | 2.28M |
| Millions | 0 | 2M |
The last row shows the risk: with 0 decimal places in millions, 2,280,550 and 1,666,550 both round to 2M.
Choose a unit and decimal places that keep the differences visible.
Auto, the default in many visuals, lets Power BI pick a unit based on the size of the numbers.
Note: Display units change only how the number looks in this visual.
The measure itself, and every other visual that uses it, stays the same.
Axes
With data labels on the columns, the axes can be quieter:
- Expand X-axis. Its Title is off by default, and can stay off. The store names explain themselves.
- Expand Y-axis. Under Values, set Display units to Millions. The Y-axis Title is off by default too.
You can also turn off the whole Y-axis with the switch next to its name.
The data labels already show every value.
Colors
Use color to point at what matters. Here, the best store:
- On the Visual tab, expand Columns.
- In the Categories list, keep All, and set Color to a light gray.
- In the Categories list, select Goldenrod City, and set Color to a strong color, for example dark green. The theme colors have no green, so select More colors... and type 1E6B3C in the Hex box.
| Store | Data label | Column color |
|---|---|---|
| Goldenrod City | 2,281K | Dark green |
| Cerulean City | 1,667K | Light gray |
| Slateport City | 1,599K | Light gray |
| Viridian City | 1,415K | Light gray |
| Lilycove City | 1,373K | Light gray |
| Violet City | 1,083K | Light gray |
Goldenrod City now stands out at once.
It sold 614,000 more than the next store, Cerulean City.
This color is fixed to Goldenrod City.
To color columns by their value instead, for example red for a low margin, use conditional formatting.
Format Painter
When one visual looks right, you can copy its formatting to another visual, just like the Format Painter in Excel:
- Select the visual that has the formatting you want.
- On the Home tab, in the Clipboard group, select Format painter.
- Select the visual you want to format.
The format painter copies the formatting, not the data.
The second visual keeps its own fields.
Report Themes
A theme sets the colors, fonts and default formatting for the whole report at once.
- On the View tab, in the Themes section, select the dropdown arrow.
- Select one of the built-in themes. All visuals get the new colors and fonts.
In the same dropdown, Customize current theme lets you change the colors and fonts of the theme for this report.
A theme does not overwrite formatting you set by hand.
The gray and green columns in the example stay gray and green until you reset the visual.
When you pick a color, choose one of the theme colors at the top of the color list when you can, rather than More colors....
Theme colors change with the theme.
A color from More colors... stays fixed, like the green of Goldenrod City.
Reset to Default
Every section of the Format visual pane has a Reset to default link at the bottom.
It removes your changes in that section, and the visual goes back to the look of the theme.
Press Ctrl + Z to undo just your last change.
Tips for Consistent Reports
- Start with a theme, instead of formatting each visual one by one.
- Use the same number format for the same kind of number everywhere, for example all sales in thousands.
- Use one strong color for what matters, and calm colors for the rest.
- Give visuals of the same kind the same size, and line up their edges. The Format tab on the ribbon has commands to align visuals.
- Write titles the same way on every visual, for example "Sales by Store", "Sales by Month".







