
Power BI DAX Row and Filter Context
One Measure, Many Answers
You have already written measures such as Total Sales.
Before you learn CALCULATE and the other advanced DAX functions, you need one key idea: context.
A measure does not have one fixed result.
Power BI calculates it again for every cell of every visual, and each cell sees a different part of the data.
The filters that decide which part of the data a cell sees are called the filter context.
This page uses the Poke Mart model described in DAX Introduction, with the Amount column from DAX RELATED and the Total Sales measure from DAX Measures.
As in the rest of the DAX chapter, amounts are formatted as Whole number with a thousands separator, and percentages as Percentage with 2 decimal places.
Total Sales in a Card
Add a Card visual and put the Total Sales measure in it.
The card shows one number, shortened to millions: 9M. The exact value is:
| Visual | Total Sales |
|---|---|
| Card | 9,416,800 |
No filters apply to the card.
Total Sales adds up the Amount of all 2,740 orders.
Total Sales in a Matrix
Now put the same measure in a matrix:
- Click an empty spot on the canvas.
- In the Visualizations pane, select the Matrix visual.
- From the Stores table, drag Region to Rows.
- From the Date table, drag Year to Columns.
- From the Sales table, drag the Total Sales measure to Values.
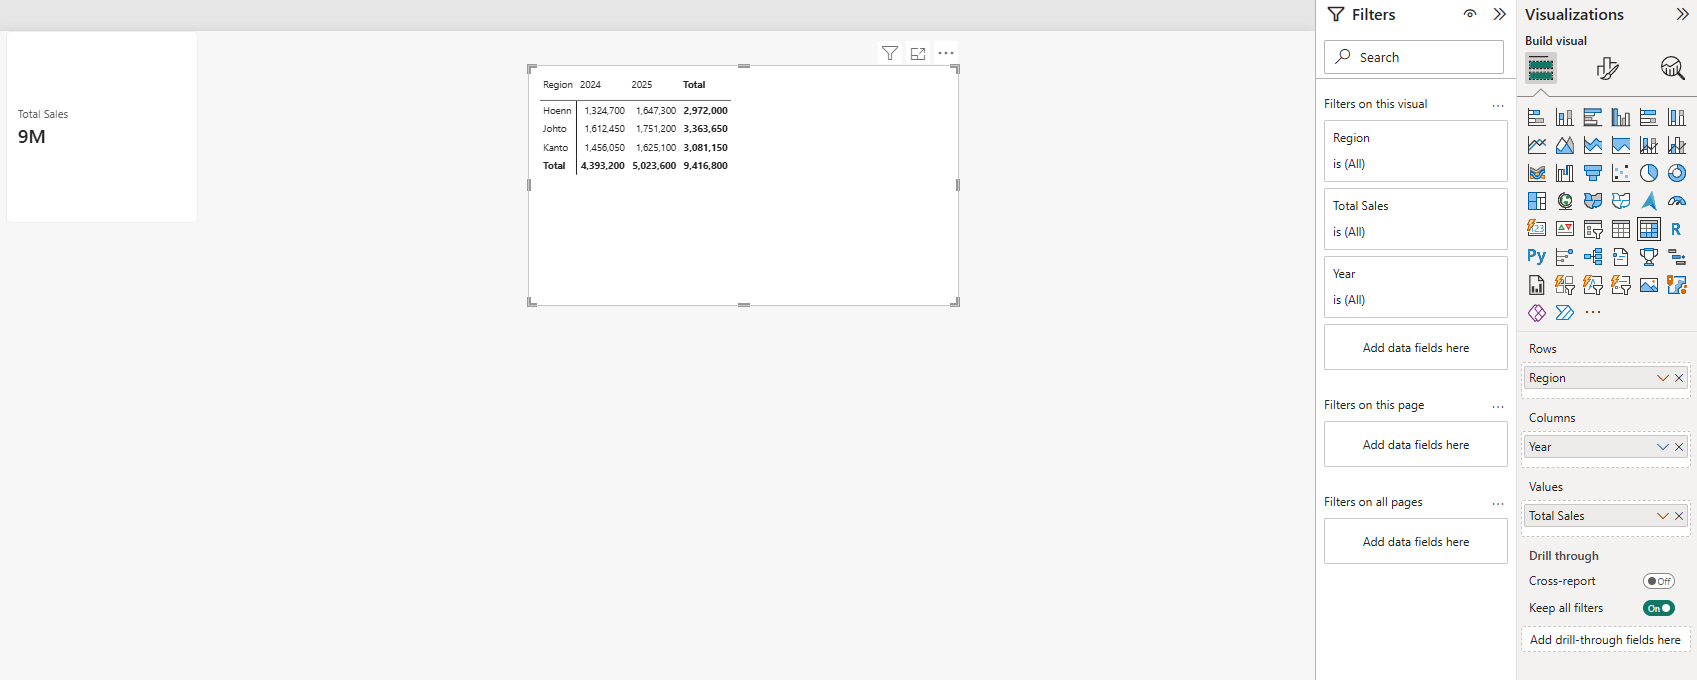
| Region | 2024 | 2025 | Total |
|---|---|---|---|
| Hoenn | 1,324,700 | 1,647,300 | 2,972,000 |
| Johto | 1,612,450 | 1,751,200 | 3,363,650 |
| Kanto | 1,456,050 | 1,625,100 | 3,081,150 |
| Total | 4,393,200 | 5,023,600 | 9,416,800 |
It is the same measure, with the same formula, SUM(Sales[Amount]).
But now it returns 12 different numbers.
Look at the cell for Johto in 2025: 1,751,200.
To get that number, Power BI:
- Filters the Stores table to Region = "Johto"
- Filters the Date table to Year = 2025
- Follows the relationships, so the Sales table keeps only the orders from Johto stores in 2025
- Calculates
SUM(Sales[Amount])over those rows
The two filters, Region = "Johto" and Year = 2025, are the filter context of that cell.
Totals Have Fewer Filters
The totals work the same way, with fewer filters:
| Cell | Filter context | Total Sales |
|---|---|---|
| Johto, 2025 | Region = Johto, Year = 2025 | 1,751,200 |
| Johto, Total | Region = Johto | 3,363,650 |
| Total, 2025 | Year = 2025 | 5,023,600 |
| Total, Total | No filters | 9,416,800 |
The grand total has no filters, just like the card.
That is why both show 9,416,800.
Note: Power BI does not add up the cells above a total.
It calculates the measure again, with fewer filters.
For Total Sales the result is the same.
For a measure like Margin % or Avg Order Value, adding up the cells would give a wrong answer, but calculating again gives the right one.
This is also why the Total row of Big Store Sales on the IF and SWITCH page shows 9,416,800.
Where Filter Context Comes From
Filters can come from many places at once.
Power BI combines all of them for every cell:
| Source | Example |
|---|---|
| Rows of a visual | Region in the Rows of the matrix |
| Columns of a visual | Year in the Columns of the matrix |
| Axis or legend of a chart | Category on the X-axis of a column chart |
| Slicers | A Category slicer with Balls selected |
| Filters pane | A filter on one visual, on the whole page, or on all pages |
| Other visuals | Selecting a column in a chart filters the other visuals on the page |
| The formula | CALCULATE, on the next page |
Filters flow along the relationships, from the lookup tables (Stores, Products and Date) to the Sales table.
This is why the star schema matters: one filter on a Region filters all the orders of that region.
Example: Add a Slicer
Add a Slicer with Category from the Products table, and select Balls.
Every cell of the matrix gets one more filter, Category = "Balls":
| Region (Balls only) | 2024 | 2025 | Total |
|---|---|---|---|
| Hoenn | 688,600 | 790,800 | 1,479,400 |
| Johto | 770,200 | 877,400 | 1,647,600 |
| Kanto | 624,800 | 695,400 | 1,320,200 |
| Total | 2,083,600 | 2,363,600 | 4,447,200 |
The Johto 2025 cell now has three filters: Region = Johto, Year = 2025 and Category = Balls. The result is 877,400.
The card changes too.
It has one filter now, Category = Balls, so Total Sales is 4,447,200. The card shortens it to 4M.
Select Balls again to clear the slicer.
Row Context
The other kind of context is row context.
It means "the current row".
You met it in Calculated Columns and RELATED.
When you created the Amount column in the Sales table, Power BI calculated the formula once for each row:
Example
Amount = Sales[Quantity] * RELATED(Products[UnitPrice])
In Table view, the first rows of the Sales table look like this (some columns not shown):
| 123OrderID | ABCProductID | 123Quantity | 123Amount |
|---|---|---|---|
| 1001 | P06 | 1 | 1,200 |
| 1002 | P01 | 19 | 3,800 |
| 1003 | P02 | 13 | 7,800 |
| 1004 | P08 | 9 | 900 |
| 1005 | P04 | 19 | 5,700 |
| ... | ... | ... | ... |
For order 1002, the current row has Quantity 19 and ProductID P01. RELATED follows the relationship to the Products table and returns the UnitPrice of P01, which is 200. The result is 19 * 200 = 3,800.
The values of a calculated column are calculated when the data is loaded or refreshed, and then stored in the table.
A slicer does not change them.
A measure is different: it is calculated each time a visual needs it, in the filter context of each cell.
Row Context vs Filter Context
| Row context | Filter context | |
|---|---|---|
| What it is | The current row of a table | The filters that apply to one cell of a visual |
| Where you meet it | Calculated columns, and inside iterator functions like SUMX | Measures in visuals |
| Created by | Going through a table one row at a time | Rows, columns, slicers, filters, other visuals, and CALCULATE |
| Example | Amount of order 1002 = 3,800 | Total Sales of Johto in 2025 = 1,751,200 |
A Measure Has No Current Row
A measure works on many rows at once, so it has no current row.
If you write a measure such as Test = Sales[Quantity], Power BI shows an error: it cannot pick one value from a column with 2,740 values.
A measure must aggregate a column, for example SUM(Sales[Quantity]).
Iterator functions like SUMX are the exception: they create a row context inside a measure.
You will learn them in SUMX and Iterators.
What You Learned
- A measure is calculated again for every cell of a visual, in that cell's filter context.
- Filter context comes from rows, columns, slicers, the Filters pane, other visuals, and the formula itself.
- Filters flow from the lookup tables to the Sales table along the relationships.
- Totals are calculated again with fewer filters, not added up.
- Row context is the current row, in calculated columns and inside iterators.
On the next page, you will change the filter context yourself, with CALCULATE.







