
Power BI Cardinality and Cross-Filter Direction
What Is Cardinality?
Every relationship has two settings that you saw in the Edit relationship dialog: Cardinality and Cross-filter direction. This chapter explains both.
Cardinality tells how many rows on each side of a relationship can have the same value.
Look at ProductID.
In Products, each ID appears exactly once.
In Sales, each ID appears on many rows:
| ProductID | Product | Rows in Products | Rows in Sales |
|---|---|---|---|
| P01 | Poke Ball | 1 | 512 |
| P02 | Great Ball | 1 | 344 |
| P03 | Ultra Ball | 1 | 179 |
| P04 | Potion | 1 | 435 |
| P05 | Super Potion | 1 | 367 |
| P06 | Hyper Potion | 1 | 155 |
| P07 | Revive | 1 | 153 |
| P08 | Antidote | 1 | 251 |
| P09 | Paralyze Heal | 1 | 185 |
| P10 | Awakening | 1 | 159 |
| Total | 10 | 2,740 |
One product, many sales.
Seen from Sales, this is a many-to-one relationship, written *:1.
Stores and Sales work the same way: each StoreID is on one row of Stores, and on 311 to 650 rows of Sales.
The Cardinality Options
In the Edit relationship dialog, the Cardinality list has four options:
| Option | Meaning | Example |
|---|---|---|
| Many to one (*:1) | Values repeat in the first table and are unique in the second | Sales to Products, Sales to Stores |
| One to many (1:*) | The same, with the tables the other way around | Products to Sales |
| One to one (1:1) | Values are unique in both tables | Stores to a table of store details, with one row per store |
| Many to many (*:*) | Values repeat in both tables | Stores to a table of targets per region and month, related on Region |
Many to one and one to many are the same relationship, seen from different ends.
Which one the dialog shows depends only on which table is listed first.
Power BI chooses the cardinality for you by looking at the data.
In a star schema, almost every relationship is many-to-one: from the fact table to a dimension table.
One-to-One
A one-to-one relationship usually means that two tables describe the same thing.
Say you had a StoreDetails table with the name of the manager of each of the six stores.
It is simpler to add that column to Stores with Merge Queries, and keep one table per thing.
Many-to-Many
Imagine sales targets set per region and month.
In that targets table, each region appears on 12 rows, one per month.
In Stores, each region appears on 2 rows, one per store.
Neither side is unique, so a relationship on Region would be many-to-many.
Many-to-many relationships are an advanced topic.
Totals can surprise readers who do not know how the tables are connected.
The Poke Mart model does not need them.
Cross-Filter Direction
A relationship does more than connect two tables.
It also carries filters from one table to the other.
When you select Status Healers in a slicer on Category, you filter the Products table.
The relationship carries that filter on to Sales, so only the orders for Status Healers are added up.
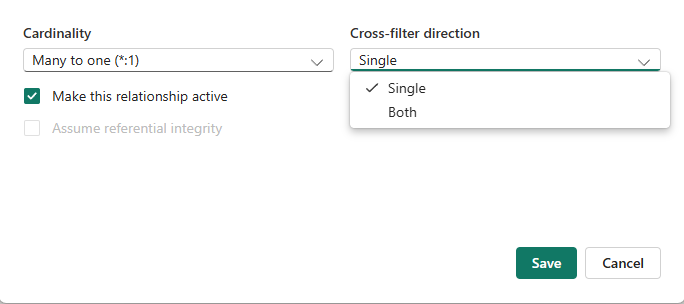
The cross-filter direction says which way filters can travel:
Single
Both
- Single: filters travel one way, from the one side to the many side: from Products to Sales. Model view shows one arrow in the middle of the line, pointing to Sales.
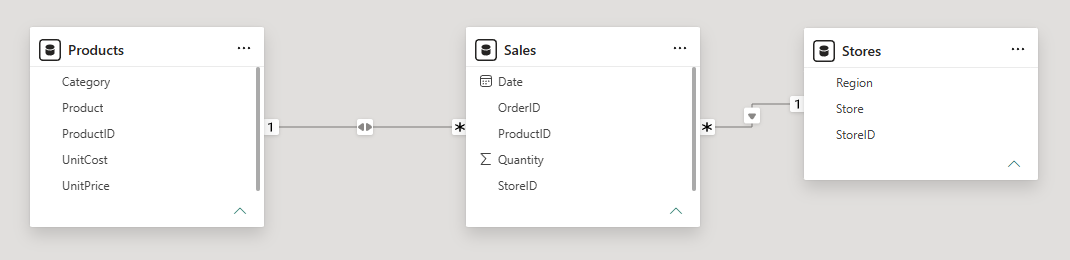
- Both: filters travel in both directions. Model view shows a double arrow.
All relationships in the Poke Mart model use Single.
You change the direction in the Edit relationship dialog:
Example: From Products to Sales
Continue in poke_mart_model.pbix, the file you built in the Star Schema and Relationships chapters.
Go to Report view and build a new table visual:
- Click an empty spot on the canvas and select Table in the Visualizations pane.
- In the Data pane, select Region from Stores, then Quantity from Sales.
- Click an empty spot on the canvas, select Slicer, and select Category from Products.
- In the slicer, select Status Healers.
| Region | Sum of Quantity (no selection) | Sum of Quantity (Status Healers) |
|---|---|---|
| Hoenn | 7,742 | 1,158 |
| Johto | 9,111 | 1,220 |
| Kanto | 7,635 | 1,121 |
| Total | 24,488 | 3,499 |
Two filters meet in Sales here:
- The slicer filters Products to 3 of its 10 rows: Antidote, Paralyze Heal and Awakening. That filter travels to Sales and keeps their 595 orders.
- Each row of the table filters Stores to one region. That filter also travels to Sales.
Both filters flow from a dimension table to the fact table, in the direction of the arrows.
This is exactly what Single direction is for.
Select Status Healers in the slicer again to clear the selection.
Example: Not From Sales Back to Products
Now try the other way: filter Sales, and count products.
- Click an empty spot on the canvas and select Table.
- Select OrderID from Sales. It lists the order numbers, because you set it to Don't summarize in the Star Schema chapter.
- Select Product from Products.
- In the Columns well of the Visualizations pane, select the arrow next to Product, and select Count.
| OrderID | Count of Product |
|---|---|
| 1001 | 10 |
| 1002 | 10 |
| 1003 | 10 |
| 1004 | 10 |
| ... | ... |
| Total | 10 |
Order 1001 is one row in Sales: one Hyper Potion.
So why does the table say 10?
Each row of the table filters Sales to one order.
With Single direction, that filter cannot travel from Sales back to Products.
Products is not filtered at all, so Power BI counts all 10 products for every order.
Change the direction to see the difference:
- In Model view, double-click the line between Sales and Products.
- Set Cross-filter direction to Both, and select Save.
The line now shows a double arrow:
Back in Report view, the counts change:
| OrderID | Product in the order | Count of Product (Single) | Count of Product (Both) |
|---|---|---|---|
| 1001 | Hyper Potion | 10 | 1 |
| 1002 | Poke Ball | 10 | 1 |
| 1003 | Great Ball | 10 | 1 |
| 1004 | Antidote | 10 | 1 |
| ... | ... | ... | ... |
| Total | 10 | 10 |
With Both, the filter on Sales travels up to Products, and each order counts its one product.
The total is still 10, because all orders together contain all 10 products.
Now set the direction back to Single before you continue.
Why Single Is the Recommended Default
If Both gives the right answer here, why not use it everywhere?
Microsoft recommends using Both as little as possible, for three reasons:
- Speed: filters that travel both ways take more work, so reports can get slower, especially when a model has many such relationships.
- Surprises: a selection in one visual can change what other visuals and slicers list. For example, a Product slicer starts to hide products that have no orders for the current selection. Some readers find this confusing.
- Ambiguity: when there is more than one path between two tables, a filter could travel either way, and the result would depend on the path. Power BI does not allow a Both setting that would make the model ambiguous.
Most questions can be answered with Single, if you count in the right table.
The fact table already knows which product each order holds:
- In the table visual, remove Count of Product.
- Select ProductID from Sales, open its menu in the Columns well, and select Count (Distinct).
The new column is called Count of ProductID, even though it counts distinct values.
Each order now shows 1, and the total shows 10, with Single direction.
If you ever need Both for a single calculation, DAX has a CROSSFILTER function that turns it on inside one formula, and leaves the relationship itself on Single.
Keep filters flowing from the dimension tables to the fact table.
That is how a star schema is meant to work.







