
Power BI Workflow
The Five Steps
Most Power BI projects follow the same five steps, from raw data to a shared report:
- Get dataConnect to Excel, CSV files, databases and more
- TransformClean and shape the data in Power Query Editor
- ModelRelate tables and write DAX measures
- VisualizeBuild report pages with charts and slicers
- Publish and sharePut the report in the Power BI service
Steps 1 to 4 happen in Power BI Desktop.
Step 5 happens in the Power BI service.
1. Get Data
Every report starts with data.
On the Home tab, select Get data to connect to a source: an Excel workbook, a CSV file, a database, a web page, or one of the many other sources Power BI supports.
A report can combine several sources.
You will do this step in the First Report chapter, and learn more sources in the Get Data chapter.
2. Transform
Real data is rarely ready to use.
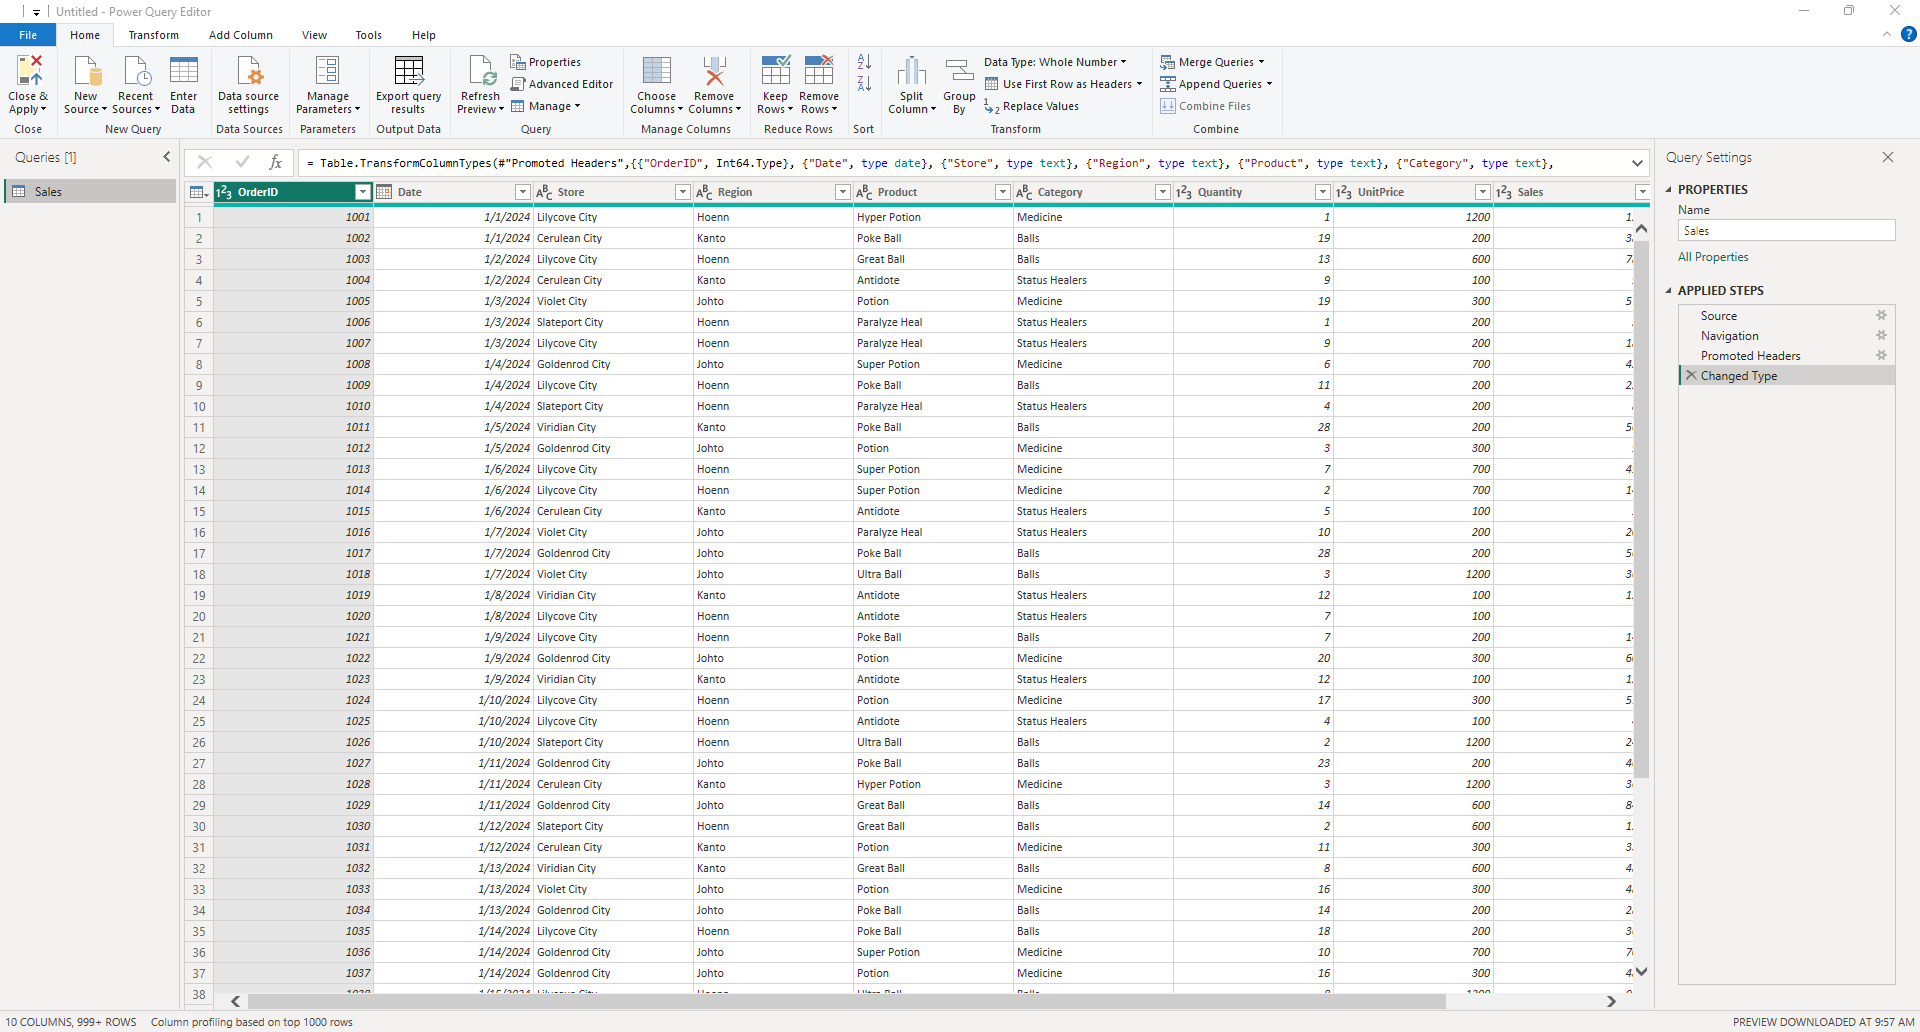
In the Power Query Editor you remove columns you do not need, fix data types, filter out bad rows and rename things.
Power Query remembers every change as a step, so it can repeat all of them each time the data is refreshed.
The Power Query chapter covers this step.
3. Model
A data model describes how your tables fit together and what you want to calculate.
In Model view you create relationships between tables, for example between a Sales table and a Products table.
You also write measures with DAX (Data Analysis Expressions), the formula language of Power BI.
The Modeling and DAX chapters cover this step.
A simple DAX measure looks like this:
Total Sales = SUM(Sales[Amount])
4. Visualize
In Report view you turn the model into report pages.
You add visuals such as cards, column charts, line charts and tables, and slicers that let readers filter the page.
All visuals on a page are connected: a click in one visual filters the others.
You build your first report in the next chapter.
5. Publish and Share
When the report is ready, select Publish on the Home tab.
Power BI asks you to save your changes first.
Then sign in with a work or school account, and select a destination workspace, for example My workspace.
Power BI uploads the report and its semantic model to the Power BI service.
There you can share the report, pin visuals to a dashboard, and schedule the data to refresh.
Sharing with others needs a paid license, as explained in Get Started.
The Power BI service is part of Microsoft Fabric, so you may see the Fabric name there too.
A later chapter will cover this step in detail.
The steps are not always done once, in order.
You will often go back: add a new column in Power Query, then a new measure, then a new chart.
Power BI Glossary
These words appear all through Power BI and this tutorial:
| Term | Meaning |
|---|---|
| Report | A file of one or more pages with interactive visuals. You build reports in Power BI Desktop and save them as .pbix files. |
| Page | One screen of a report. Each page has its own tab at the bottom of the canvas. |
| Visual | One chart, table, card, map or slicer on a page. Also called a visualization. |
| Semantic model | The data behind a report, with its tables, relationships and measures. It was called a dataset in older versions of Power BI. |
| Dashboard | A single page of tiles in the Power BI service. Each tile is a visual pinned from a report. Dashboards cannot be made in Power BI Desktop. |
| Workspace | A place in the Power BI service where reports, semantic models and dashboards are stored and shared. Everyone has a personal My workspace. |







