
Power BI DAX Measures
What is a Measure?
A measure is a DAX formula that returns one value, such as a total, a count or a ratio.
Unlike a calculated column, a measure is not stored row by row.
Power BI calculates it when a visual needs it, for exactly the data that the visual shows.
That is why the same measure can show the total for the whole shop in a card, and the total for each category in a chart.
This page uses the Poke Mart model described in DAX Introduction, with the Amount column from DAX RELATED.
Create a Measure
Your first measure adds up the Amount column that you created in the RELATED chapter.
All the measures in this tutorial are stored in the Sales table.
- In the Data pane, select the Sales table.
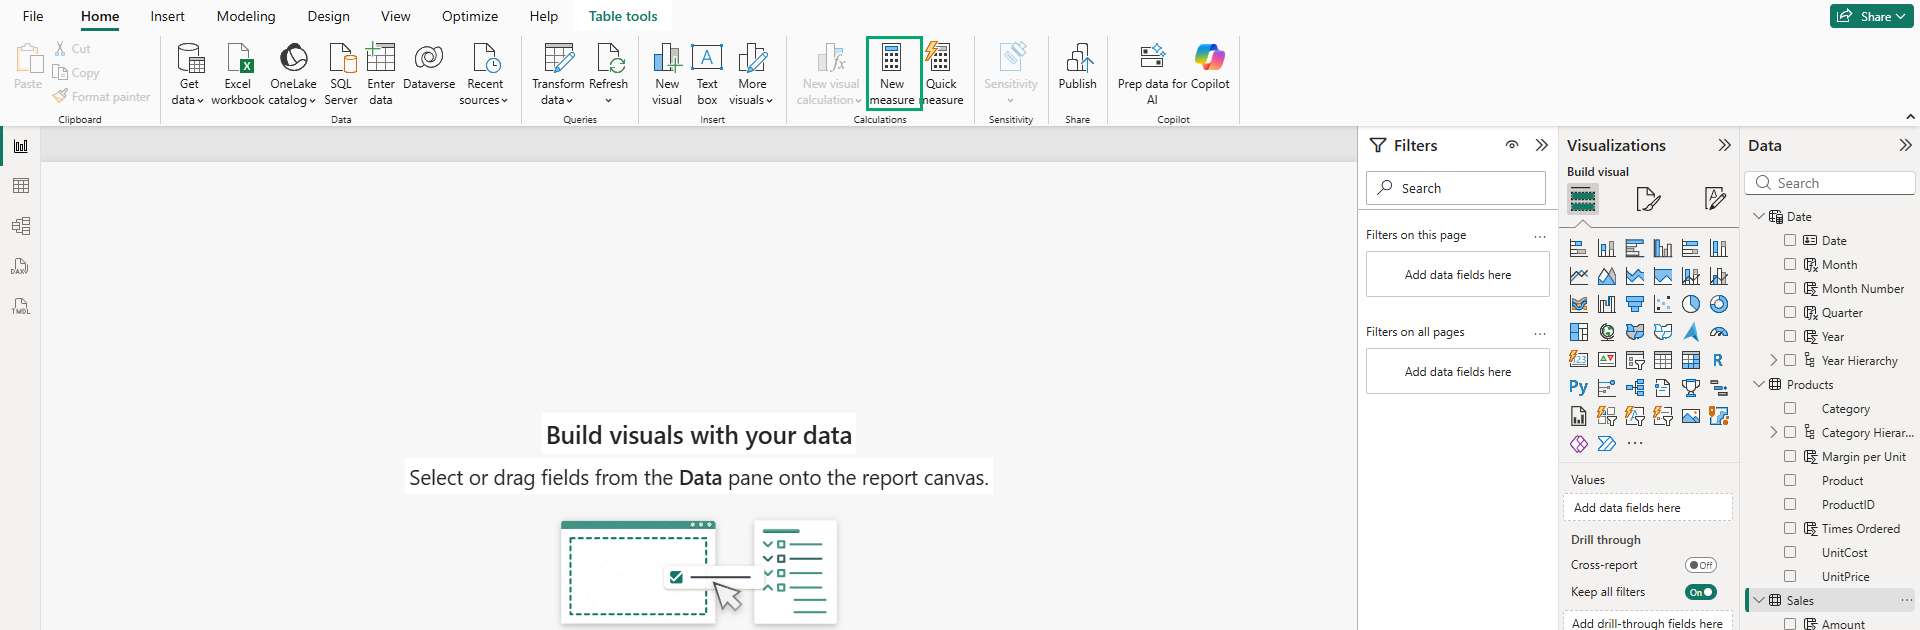
- On the Home tab, in the Calculations group, select New measure. You can also right-click Sales in the Data pane and select New measure.
- The formula bar opens with the text Measure = . Replace the whole text with the formula below.
- Press Enter.
Example
Total Sales = SUM(Sales[Amount])
The new measure appears in the Sales table in the Data pane, with a calculator icon.
If the measure ended up in another table, select it, and on the Measure tools tab, change Home table to Sales.
Format the Measure
When a measure is selected, the Measure tools tab appears in the ribbon.
Its Formatting group sets how the numbers look:
- Select Total Sales in the Data pane.
- On the Measure tools tab, check that Format is set to Whole number. For Total Sales, it already is.
- Select the comma button (,) to show a thousands separator. It is off at first.

In this tutorial, all measures are formatted as Whole number with a thousands separator, so 9416800 is shown as 9,416,800. Percentages and averages are the exceptions, and their pages tell you the format.
For example, Margin % is formatted as Percentage with 2 decimal places, and Avg Order Value as Decimal number with 2 decimal places.
Format each new measure when you create it.
One Measure, Many Results
Now use the measure in two visuals.
In a Card
- Select Report view, click an empty spot on the canvas, and select the Card visual.
- In the Data pane, select Total Sales.
The card shows the total of all 2,740 orders:
| Visual | Total Sales |
|---|---|
| Card | 9,416,800 |
As in First Report, the card shortens the number to millions: it shows 9M.
The table above has the exact value.
By Category
- Click an empty spot on the canvas, and select the Table visual.
- In the Data pane, select Category in the Products table, then Total Sales.
| Category | Total Sales |
|---|---|
| Balls | 4,447,200 |
| Medicine | 4,413,600 |
| Status Healers | 556,000 |
| Total | 9,416,800 |
You wrote one formula, but it returned four different numbers.
For the Balls row, Power BI calculated SUM(Sales[Amount]) over the Sales rows of Balls only.
For the Total row, it used all the rows.
The filters that apply to a calculation are called its filter context.
Each cell of a visual has its own filter context.
Slicers and filters on the page add to it: with Johto selected in a Region slicer, the card shows 3,363,650 (shortened on the card, for example 3M).
You learn more about this in DAX Context.
Calculated Columns vs Measures
Both are written in DAX, but they work in different ways:
| Calculated column | Measure | |
|---|---|---|
| Returns | One value for every row of a table | One value for each cell of a visual |
| Calculated | When the data is loaded or refreshed | When a visual needs it |
| Stored | Yes, a value for every row. It makes the file bigger. | No, only the formula is stored |
| Context | Row context: the current row | Filter context: the filters from the visual, slicers and the page |
| Changes when you use a slicer | No | Yes |
| Use it in | Slicers, filters, rows, axes and legends | The values of a visual: totals, counts, ratios |
| Poke Mart examples | Sales[Amount], Products[Margin per Unit] | Total Sales, Margin % |
A simple rule: if you want to group or filter by the result, use a calculated column.
If you want to add up, count or compare, use a measure.
Implicit and Explicit Measures
In First Report, you never wrote a measure, but the card still showed Sum of Sales.
When you add a number column to a visual, Power BI adds it up for you.
This automatic calculation is called an implicit measure.
A measure that you write yourself, like Total Sales, is an explicit measure.
Microsoft also calls it a model measure.
| Implicit measure | Explicit measure | |
|---|---|---|
| Created | Automatically, when you add a number column to a visual | By you, with New measure and a DAX formula |
| Name | Chosen by Power BI, like Sum of Amount | Any name you choose, like Total Sales |
| Calculation | Simple ones only: sum, average, count, minimum, maximum and a few more | Any DAX formula |
| Used in other measures | No | Yes, for example Profit = [Total Sales] - [Total Cost] |
Use explicit measures for everything you calculate more than once.
You name a measure once, format it once, and can reuse it in other measures.
From now on, this tutorial uses measures such as Total Sales in visuals, instead of the Amount column.
Good job! You have created your first measure.
In the next chapter, you create more measures with other aggregation functions.







