
Power BI Star Schema
One Big Table
In the First Report chapter, all the Poke Mart data was in one table.
Each row held everything about one order: the date, the store, the region, the product, the category, the price and the totals.
A table like this is called a flat table.
Here are its first rows:
| 123OrderID | DATEDate | ABCStore | ABCRegion | ABCProduct | ABCCategory | 123Quantity | 123UnitPrice | 123Sales | 123Cost |
|---|---|---|---|---|---|---|---|---|---|
| 1001 | 1/1/2024 | Lilycove City | Hoenn | Hyper Potion | Medicine | 1 | 1200 | 1200 | 680 |
| 1002 | 1/1/2024 | Cerulean City | Kanto | Poke Ball | Balls | 19 | 200 | 3800 | 2090 |
| 1003 | 1/2/2024 | Lilycove City | Hoenn | Great Ball | Balls | 13 | 600 | 7800 | 4290 |
| 1004 | 1/2/2024 | Cerulean City | Kanto | Antidote | Status Healers | 9 | 100 | 900 | 405 |
| 1005 | 1/3/2024 | Violet City | Johto | Potion | Medicine | 19 | 300 | 5700 | 2850 |
| ... | ... | ... | ... | ... | ... | ... | ... | ... | ... |
The table has 2,740 rows and 10 columns.
It works, but it has three problems:
- Repetition: the same names are typed again and again. The pair "Goldenrod City, Johto" is on 650 rows. "Poke Ball", "Balls" and the price 200 are on 512 rows.
- Size: 2,740 rows times 10 columns is 27,400 values, and most of the text values are copies.
- Updates: if the shop moves Revive to a new category, you must change 153 rows. Miss one, and your report shows Revive in two categories.
Fact Tables and Dimension Tables
A star schema splits the data into two kinds of tables:
| Fact table | Dimension table | |
|---|---|---|
| Holds | Events, such as orders | The things that take part in the events, such as products, stores and dates |
| One row per | Event (one order) | Thing (one product) |
| Columns | Keys that point to the dimension tables, and numbers to add up | A unique key, and columns to filter and group by |
| Number of rows | Many, and more every day | Few |
| Poke Mart | Sales | Products, Stores, Date |
Dimension tables are for filtering and grouping.
The fact table is for adding up.
A key is a column that identifies each row, such as ProductID.
The fact table stores only the key, for example P01. The dimension table stores each key once, together with the details: P01 is a Poke Ball, in the Balls category, with a unit price of 200.
If you know Excel, this is like VLOOKUP: the sales list holds a product ID, and you look up the name and the price in a product list.
The Poke Mart Star
This is the star schema you build in this chapter:
- OrderID
- Date
- StoreID
- ProductID
- Quantity
- ProductID
- Product
- Category
- UnitPrice
- UnitCost
- StoreID
- Store
- Region
- Date
- Year
- Quarter
- Month Number
- Month
Bold columns are keys. Each line runs from a key in a dimension table (the 1 side, where each value appears once) to the same key in Sales (the * side, where it appears many times).
- Sales is the fact table in the middle: one row per order, 2,740 rows.
- Products has one row per product: 10 rows.
- Stores has one row per store: 6 rows.
- Date will have one row per day. You create it in the Date Table chapter.
The dimension tables sit around the fact table like the points of a star.
That is where the name comes from.
Real models often have more points, such as customers, employees and suppliers.
Flat vs Star
The star holds the same information as the flat table.
Count the values in each design:
| Table | Rows | Columns | Values |
|---|---|---|---|
| Flat: Sales | 2,740 | 10 | 27,400 |
| Star: Sales | 2,740 | 5 | 13,700 |
| Star: Products | 10 | 5 | 50 |
| Star: Stores | 6 | 3 | 18 |
| Star: total | 13,768 |
The star needs about half as many values.
Every name is stored once: "Goldenrod City" is on one row of Stores, instead of on 650 rows of Sales.
Updates get easier too.
To move Revive to a new category, you change one cell in Products, and all of its 153 orders follow.
Where did the Sales and Cost columns go?
They can be calculated: Quantity from Sales, times UnitPrice or UnitCost from Products.
You add them with DAX in the RELATED chapter.
Note: Power BI stores the data it loads in a compressed form, so a star schema does not make your file exactly half the size.
The main reasons to use a star are that the model is easier to use, easier to keep correct, and fits the way Power BI filters and adds up data.
Load the Star Schema
Download the practice file.
It has three sheets: Sales, Products and Stores.
- Open Power BI Desktop and start a blank report.
- On the Home tab, select Get data > Excel workbook. If a pop-up named Introducing the new Get Data experience! appears, select No thanks.
- Find poke_mart_model.xlsx and select Open.
- In the Navigator window, select the check boxes next to Products, Sales and Stores.
- Select Load.
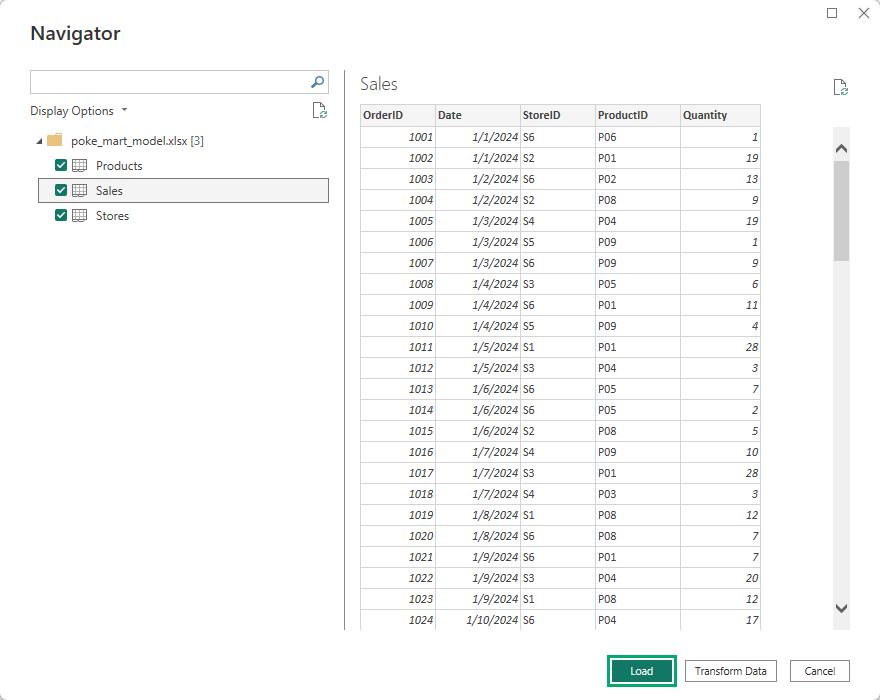
Power BI loads the three sheets as three tables.
Fix the Stores Headers
The Stores sheet holds only text, so Power Query cannot tell its header row from the data rows.
Stores loads with the columns Column1, Column2 and Column3, and the headers StoreID, Store and Region end up as its first data row.
Fix it in the Power Query Editor:
- On the Home tab, select Transform data. The Power Query Editor opens.
- In the Queries pane on the left, select Stores.
- On the Home tab of the editor, select Use First Row as Headers.
- Select Close & Apply.
Stores now has the columns StoreID, Store and Region, and 6 rows.
Select Table view on the left side of the window to see the rows of the three tables.
Sales (2,740 rows)
| 123OrderID | DATEDate | ABCStoreID | ABCProductID | 123Quantity |
|---|---|---|---|---|
| 1001 | Monday, January 1, 2024 | S6 | P06 | 1 |
| 1002 | Monday, January 1, 2024 | S2 | P01 | 19 |
| 1003 | Tuesday, January 2, 2024 | S6 | P02 | 13 |
| 1004 | Tuesday, January 2, 2024 | S2 | P08 | 9 |
| 1005 | Wednesday, January 3, 2024 | S4 | P04 | 19 |
| 1006 | Wednesday, January 3, 2024 | S5 | P09 | 1 |
| ... | ... | ... | ... | ... |
Order 1001 is the same order as in the flat table: store S6 is Lilycove City, and product P06 is a Hyper Potion.
Products (10 rows)
| ABCProductID | ABCProduct | ABCCategory | 123UnitPrice | 123UnitCost |
|---|---|---|---|---|
| P01 | Poke Ball | Balls | 200 | 110 |
| P02 | Great Ball | Balls | 600 | 330 |
| P03 | Ultra Ball | Balls | 1200 | 700 |
| P04 | Potion | Medicine | 300 | 150 |
| P05 | Super Potion | Medicine | 700 | 380 |
| P06 | Hyper Potion | Medicine | 1200 | 680 |
| P07 | Revive | Medicine | 1500 | 900 |
| P08 | Antidote | Status Healers | 100 | 45 |
| P09 | Paralyze Heal | Status Healers | 200 | 95 |
| P10 | Awakening | Status Healers | 250 | 120 |
Stores (6 rows)
| ABCStoreID | ABCStore | ABCRegion |
|---|---|---|
| S1 | Viridian City | Kanto |
| S2 | Cerulean City | Kanto |
| S3 | Goldenrod City | Johto |
| S4 | Violet City | Johto |
| S5 | Slateport City | Hoenn |
| S6 | Lilycove City | Hoenn |
See the Model
Select Model view on the left side of the window.
Model view shows each table as a box with its columns.
The lines between the boxes are relationships.
Power BI created them by itself, because the tables share the columns ProductID and StoreID.
The Sales to Products line came with the first load.
The Sales to Stores line came after you fixed the Stores headers and selected Close & Apply.
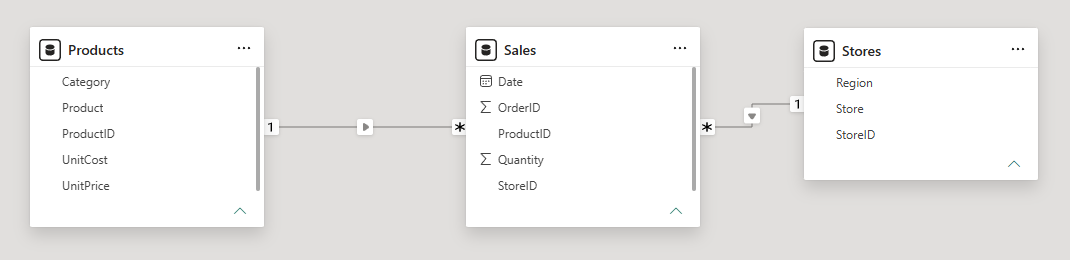
Your model already looks like the star in the diagram, without the Date table.
The next chapter explains the lines.
Stop Summarizing OrderID
In the First Report chapter, OrderID had a sigma sign (Σ) in the Data pane, because Power BI planned to add it up.
OrderID in this Sales table has a sigma sign too.
Here its Summarization is set to Count, so a visual would count the orders instead of listing them. Fix it now:
- Select Report view on the left side of the window.
- In the Data pane, expand Sales and select OrderID.
- On the Column tools tab, set Summarization to Don't summarize.
The sigma sign is gone.
When you add OrderID to a visual, Power BI now lists the order numbers instead of counting them.
Leave Quantity as it is.
Adding up quantities makes sense.
Save the Report
The report has never been saved, so File > Save is dimmed.
Select File > Save as > Browse this device, name the file poke_mart_model, and select Save.
You keep working in this file for the rest of the Modeling chapter, and in the DAX chapter.







