
Power BI Power Query Columns
Shape the Columns
The first job in most cleanups is to get the columns right. In this chapter you:
- Remove the Notes column
- Rename Qty to Quantity and Price to UnitPrice
- Learn how to move columns
- Add a Sales column with a formula
This page continues the cleanup from Power Query Editor.
Open pq_cleanup.pbix, the report you saved there, select Home > Transform data, and select the last step of the poke_mart_raw_2024 query, Changed Type.
This is where you start.
The query has 1,285 rows and seven columns:
| 123OrderID | DATEOrderDate | ABCLocation | ABCProduct | 123Qty | 123Price | ABCNotes |
|---|---|---|---|---|---|---|
| 1001 | 1/1/2024 | Lilycove City - Hoenn | Hyper Potion | 1 | 1200 | |
| 1002 | 1/1/2024 | Cerulean City - Kanto | poke ball | 19 | 200 | |
| 1003 | 1/2/2024 | Lilycove City - Hoenn | Great Ball | 13 | 600 | |
| 1004 | 1/2/2024 | Cerulean City - Kanto | Antidote | 9 | 100 | |
| 1005 | 1/3/2024 | Violet City - Johto | Potion | 19 | 300 | |
| 1006 | 1/3/2024 | Slateport City - Hoenn | Paralyze Heal | 1 | 200 | |
| ... | ... | ... | ... | ... | ... | ... |
Remove a Column
The Notes column is empty in most rows.
Only 45 of the 1,285 rows have a note, such as "phone order" or "gift wrap".
The report does not need it.
- Select the Notes column header.
- On the Home tab, select the arrow under Remove Columns.
- Select Remove Columns.
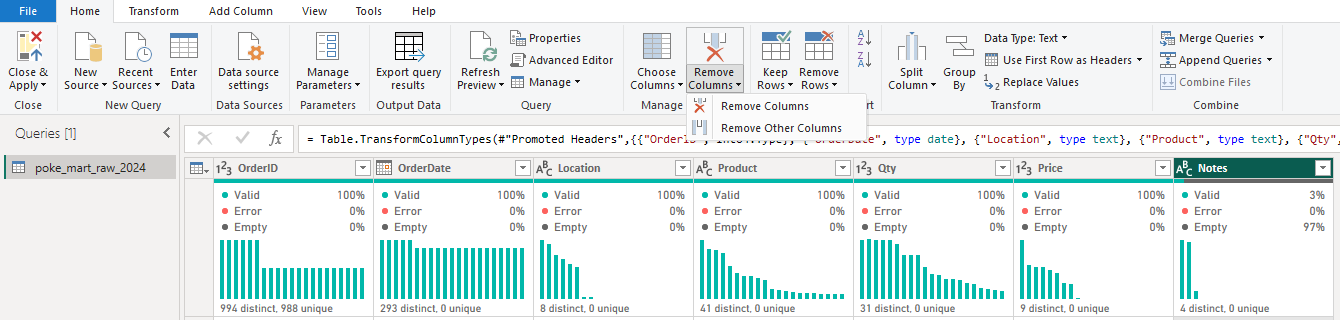
Notes is gone, and a new step, Removed Columns, appears in the Applied Steps list.
You can also right-click the header and select Remove.
To remove several columns at once, hold Ctrl and click each header first.
Remove Columns or Remove Other Columns?
The Remove Columns dropdown has two commands:
| Command | What it does | Use it when |
|---|---|---|
| Remove Columns | Removes the selected columns | You want to drop a few columns and keep most |
| Remove Other Columns | Keeps the selected columns and removes all the others | You want to keep a few columns and drop most |
There is one more difference.
Remove Other Columns remembers the columns you keep, and Remove Columns remembers the columns you remove.
So if the source ever gets a new column, Remove Other Columns drops it, while Remove Columns lets it through into your report.
Here you want to drop one column out of seven, so Remove Columns is the quicker choice.
Home > Choose Columns does the same job with a list of check boxes, which is handy for wide tables.
Rename Columns
Qty and Price are short, but not very clear.
The column names you choose here become the field names in your report, so give them clear names.
- Double-click the Qty header.
- Type Quantity and press Enter.
- Double-click the Price header.
- Type UnitPrice and press Enter.
A step called Renamed Columns appears.
When you rename two columns right after each other, Power Query puts both renames in the same step.
You can also right-click a header and select Rename..., or use Transform > Rename.
Two columns cannot have the same name.
If you try, Power Query shows a Column Name Conflict message, and you must choose another name.
Move Columns
To move a column, drag its header to a new place.
Or select the column and use Transform > Move, which moves it one place left or right, or to the beginning or the end.
The Poke Mart columns are already in a good order, so you do not need to move anything.
If you try it out, delete the Reordered Columns step afterwards: select the X next to it in Applied Steps.
That way your query stays the same as in this tutorial.
The column order in Power Query matters less than you might think.
The Data pane of your report lists the fields in alphabetical order anyway.
Add a Custom Column
The file has the quantity and the unit price of each order, but not the sales amount.
You can calculate it with a custom column:
Sales = [Quantity] * [UnitPrice]
- On the Add Column tab, select Custom Column.
- In New column name, type Sales.
- Click in the Custom column formula box, after the equal sign. The box always starts with
=, and you cannot delete it, so do not type an equal sign yourself. - In the Available columns list, double-click Quantity. Power Query writes
[Quantity]in the formula. - Type
*(a space, an asterisk and a space). - Double-click UnitPrice in the list.
- Check the message at the bottom of the dialog: No syntax errors have been detected.
- Select OK.
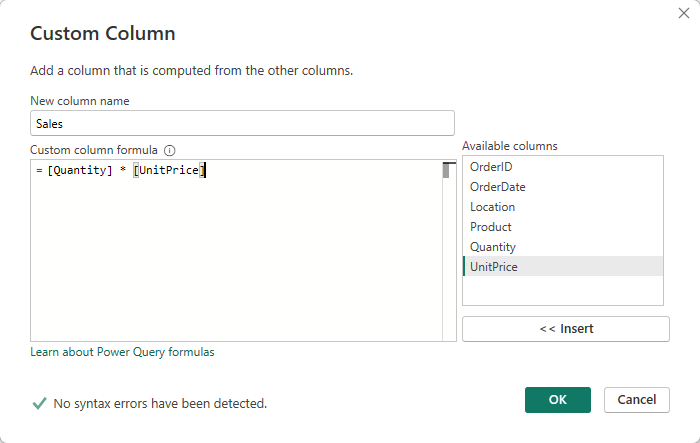
The formula box now holds this:
= [Quantity] * [UnitPrice]
A column name in square brackets means "the value in this column, in the current row".
Power Query runs the formula once for each row.
Note: Power Query formulas are case-sensitive.
[quantity] with a small q is not the same as [Quantity], and gives an error.
Double-clicking the column names in the list avoids typing mistakes.
This is why you renamed the columns first: the formula uses the new, clear names.
The Result
A new step, Added Custom, is added, and the new Sales column appears at the right end of the table:
| 123OrderID | DATEOrderDate | ABCLocation | ABCProduct | 123Quantity | 123UnitPrice | ABC123Sales |
|---|---|---|---|---|---|---|
| 1001 | 1/1/2024 | Lilycove City - Hoenn | Hyper Potion | 1 | 1200 | 1200 |
| 1002 | 1/1/2024 | Cerulean City - Kanto | poke ball | 19 | 200 | 3800 |
| 1003 | 1/2/2024 | Lilycove City - Hoenn | Great Ball | 13 | 600 | 7800 |
| 1004 | 1/2/2024 | Cerulean City - Kanto | Antidote | 9 | 100 | 900 |
| 1005 | 1/3/2024 | Violet City - Johto | Potion | 19 | 300 | 5700 |
| 1006 | 1/3/2024 | Slateport City - Hoenn | Paralyze Heal | 1 | 200 | 200 |
| ... | ... | ... | ... | ... | ... | ... |
Check the first rows: 19 Poke Balls at 200 each make 3800, and 13 Great Balls at 600 each make 7800. The query still has 1,285 rows.
Look at the icon in the Sales header: ABC123.
That is the type Any.
In Power BI Desktop, the Custom Column dialog has no box for the data type, so a new custom column has no type yet.
You fix that in the next chapter, Data Types.
Select the Added Custom step and look at the formula bar.
It shows something similar to this:
= Table.AddColumn(#"Renamed Columns", "Sales", each [Quantity] * [UnitPrice])
In words: take the table from the step Renamed Columns, and add a column called Sales, with each row's Quantity times its UnitPrice.
Your Applied Steps are now: Source, Promoted Headers, Changed Type, Removed Columns, Renamed Columns and Added Custom. Good job!
Select Close & Apply, then File > Save to save pq_cleanup.pbix.
The next page continues from here.







