
Power BI Table and Matrix
Table and Matrix
Tables and matrices show exact numbers in rows and columns.
Use them when readers need to look up values, not just see a pattern.
| Table | Matrix | |
|---|---|---|
| Wells | Columns | Rows, Columns, Values |
| Layout | A flat list, one row per item | Grouped rows and columns, like a PivotTable |
| Totals | One Total row | A subtotal for every group, plus grand totals |
| Levels | One level | Levels you can expand and collapse |
If you know Excel, a matrix works much like a PivotTable.
This page uses your file from the DAX chapter, for example poke_mart_dax.pbix (see Power BI Visuals for what it holds), with the measures Units Sold, Total Sales and Margin %.
Create a Table
Build a table with one row per product:
- Click an empty spot on the canvas.
- In the Visualizations pane, select Table.
- In the Data pane, expand Products and select Product.
- Expand Sales and select the measures Units Sold, Total Sales and Margin %, in that order.
Power BI adds the four fields to the Columns well, in the order you selected them.
The order of the fields in the well is the order of the columns in the table.
To move a column, drag its field up or down in the well.
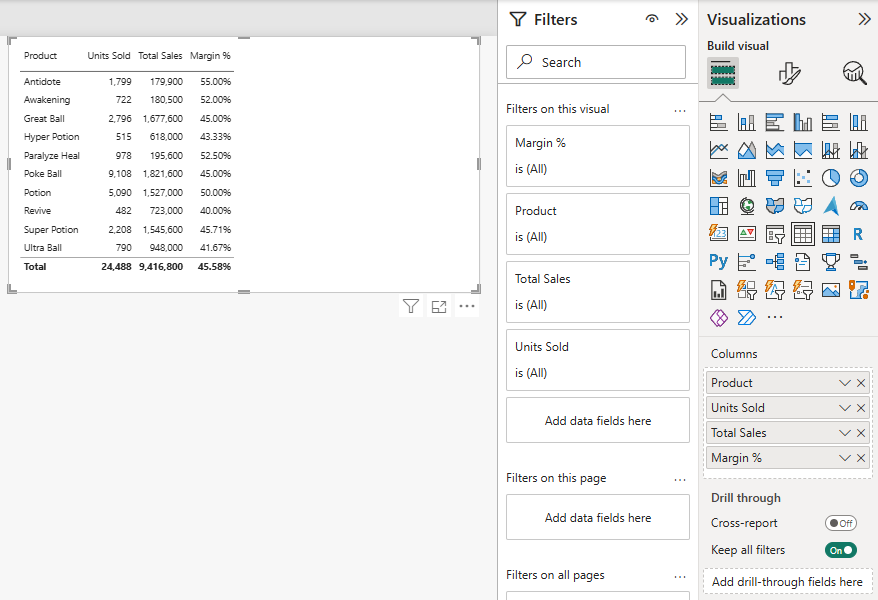
Your table should show these values.
Here the rows are sorted by Product, A to Z:
| Product | Units Sold | Total Sales | Margin % |
|---|---|---|---|
| Antidote | 1,799 | 179,900 | 55.00% |
| Awakening | 722 | 180,500 | 52.00% |
| Great Ball | 2,796 | 1,677,600 | 45.00% |
| Hyper Potion | 515 | 618,000 | 43.33% |
| Paralyze Heal | 978 | 195,600 | 52.50% |
| Poke Ball | 9,108 | 1,821,600 | 45.00% |
| Potion | 5,090 | 1,527,000 | 50.00% |
| Revive | 482 | 723,000 | 40.00% |
| Super Potion | 2,208 | 1,545,600 | 45.71% |
| Ultra Ball | 790 | 948,000 | 41.67% |
| Total | 24,488 | 9,416,800 | 45.58% |
The Total Row
Look at the Total row.
Units Sold and Total Sales are the sums of the rows above.
Margin % is different.
The total is not the sum of the ten percentages (470.21%), and not their average either (47.02%). It is 45.58%.
That is because Power BI does not add up the numbers you see.
It calculates every total with the measure itself, over all the rows in the total.
For the Total row, DIVIDE([Profit], [Total Sales]) is calculated for all products together.
This is why ratios like Margin % must be measures.
You can read more about it in DAX Context.
Sort a Table
Select a column header to sort the table by that column.
A small arrow in the header shows the sort order.
Select the header again to reverse the order.
Sorted by Total Sales, largest first, Poke Ball (1,821,600) is at the top and Antidote (179,900) is at the bottom.
Sorted by Margin %, largest first, Antidote comes first with 55.00%.
A cheap product can have the best margin and the smallest sales.
A table lets readers see all three measures at once.
Create a Matrix
Now build a matrix with regions and stores down the side and years across the top:
- Click an empty spot on the canvas.
- In the Visualizations pane, select Matrix.
- In the Data pane, expand Stores and select Region. It goes to the Rows well. Then drag Store to the Rows well, below Region. Drag it, do not select its check box: with the check box, Power BI puts Store in the Columns well. You can also drag the Region > Store hierarchy from the Hierarchies chapter to Rows.
- Expand the Date table and drag Year to the Columns well. Drag it, do not select its check box: Year is a number, so the check box could add it to Values as a sum of years.
- Expand Sales and select Total Sales. It goes to the Values well.
The matrix starts at the top level of the rows.
It shows one row per region, and one column per year:
| Region | 2024 | 2025 | Total |
|---|---|---|---|
| Hoenn | 1,324,700 | 1,647,300 | 2,972,000 |
| Johto | 1,612,450 | 1,751,200 | 3,363,650 |
| Kanto | 1,456,050 | 1,625,100 | 3,081,150 |
| Total | 4,393,200 | 5,023,600 | 9,416,800 |
Every region sold more in 2025 than in 2024.
Expand and Collapse
The stores are hidden inside the regions.
There are two ways to show them:
- Select the + next to a region, for example Johto, to show only Johto's stores. Select the - to hide them again.
- Point to the matrix and select Expand all down one level in the hierarchy in the icons above or below the visual. This shows the stores of every region.
A new matrix shows the + icons by default.
You can turn them off in Format visual > Visual > Row headers > +/- icons.
Fully expanded, the matrix looks like this:
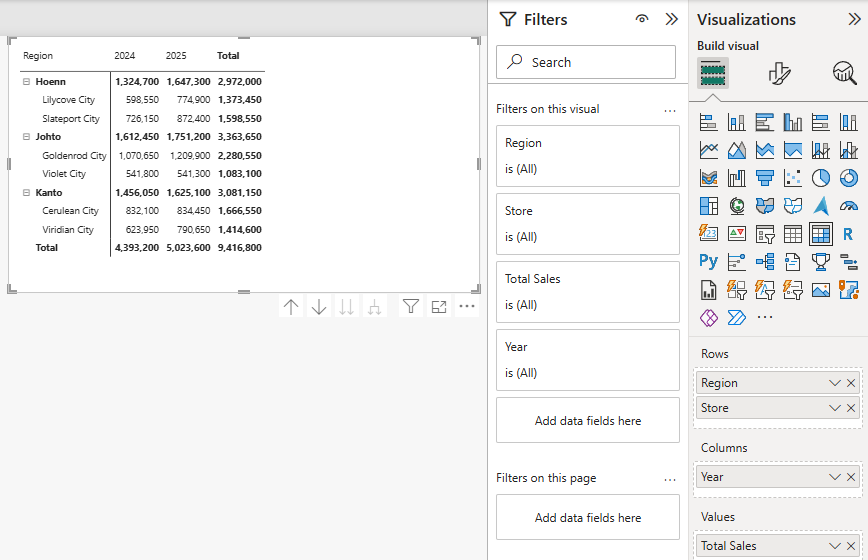
These are the values of the expanded matrix.
The bold rows are the regions:
| Region / Store | 2024 | 2025 | Total |
|---|---|---|---|
| Hoenn | 1,324,700 | 1,647,300 | 2,972,000 |
| Lilycove City | 598,550 | 774,900 | 1,373,450 |
| Slateport City | 726,150 | 872,400 | 1,598,550 |
| Johto | 1,612,450 | 1,751,200 | 3,363,650 |
| Goldenrod City | 1,070,650 | 1,209,900 | 2,280,550 |
| Violet City | 541,800 | 541,300 | 1,083,100 |
| Kanto | 1,456,050 | 1,625,100 | 3,081,150 |
| Cerulean City | 832,100 | 834,450 | 1,666,550 |
| Viridian City | 623,950 | 790,650 | 1,414,600 |
| Total | 4,393,200 | 5,023,600 | 9,416,800 |
Now you can see something the region rows hid: Violet City is the only store that sold less in 2025 (541,300) than in 2024 (541,800).
The other drill icon, Go to the next level in the hierarchy, shows the stores without the regions above them.
Subtotals and Grand Totals
A matrix has three kinds of totals:
- Row subtotals: the bold region rows. Each one is the total of its stores. In the default layout, called Compact, the subtotal is on the same row as the region name.
- Column subtotals: the Total column, which adds up the years.
- Grand total: the Total row at the bottom, 9,416,800.
Just like in the table, Power BI calculates each subtotal with the measure, for all the rows in that group.
To change the totals, select the matrix, select Format visual, and open the Visual tab:
- Turn off Row subtotals to hide the row totals. This hides the grand Total row at the bottom too.
- Turn off Column subtotals to hide the Total column.
- To show Region and Store in two separate columns, like a classic PivotTable, expand Layout > Matrix layout and choose Outline or Tabular instead of Compact.
Note: A table has only one Total row, and no subtotals.
If you need subtotals by group, use a matrix.







