
Power BI Date Table
Why a Date Table?
A date table is a dimension table with one row for every day, and columns such as Year, Quarter and Month.
In the First Report chapter, Power BI made a Year, Quarter, Month and Day hierarchy for the Date column by itself.
This feature is called auto date/time.
It is handy for a quick report, but it has limits:
- Power BI adds a hidden date table for every date column, which makes the model bigger.
- You cannot see those hidden tables, or add your own columns to them, such as a fiscal year.
- Each hidden table belongs to one column. One date table cannot filter several fact tables, for example sales and targets.
Your own date table fixes all three.
It is also needed for the time intelligence functions in the DAX chapter, such as sales year to date, or sales in the same period last year.
A date table must follow a few rules:
- One row per date, with no date twice and no blank dates.
- No missing days between the first date and the last date.
- Whole years, from January 1 to December 31.
Why not just use the Date column in Sales?
In the Poke Mart data, every day of 2024 and 2025 happens to have at least one order.
A real shop has days without sales, such as holidays, and those dates would be missing.
Create the Date Table with DAX
You create the date table with one line of DAX.
Open poke_mart_model.pbix, the file you built in the Star Schema chapter and changed in the chapters after it, then:
- Select Report view.
- On the Modeling tab, select New table. A formula bar opens above the canvas.
- Replace the text in the formula bar with the formula below, and press Enter.
Example
Date = CALENDAR(DATE(2024, 1, 1), DATE(2025, 12, 31))

A new table called Date appears in the Data pane.
Power BI also adds the Table tools tab to the ribbon and switches to it.
In the picture, the Modeling tab is selected again to show the New table button.
This is how the formula works:
Date =names the new table.DATE(2024, 1, 1)builds a date from a year, a month and a day: January 1, 2024.CALENDARreturns a table with one column, also called Date, with every day from the first date to the last date, both included.
The table has 731 rows: 366 days in 2024, which is a leap year, and 365 days in 2025.
A table made by a DAX formula is called a calculated table.
It lives in the model, next to the tables you loaded from Excel.
Select the new Date column in the Data pane.
On the Column tools tab, Data type shows Date/time.
Change it to Date, because the table holds days, not times.
The dates then show in the long date format, such as Monday, January 1, 2024.
Add the Date Columns
Now add four columns to the Date table. For each one:
- Select the Date table in the Data pane.
- On the Table tools tab, select New column.
- Type the formula in the formula bar and press Enter.
Year
Year = YEAR('Date'[Date])
Quarter
Quarter = "Q" & QUARTER('Date'[Date])
Month Number
Month Number = MONTH('Date'[Date])
Month
Month = FORMAT('Date'[Date], "MMM")
YEARreturns the year, such as 2024.QUARTERreturns a number from 1 to 4. The&sign joins it to the letter Q, so you get Q1 to Q4.MONTHreturns a number from 1 to 12.FORMATwith"MMM"returns the short month name: Jan, Feb, Mar and so on.
'Date'[Date] means the Date column of the Date table.
The table name is in single quotes, because Date is also the name of a DAX function.
A column made by a DAX formula is called a calculated column.
You learn more about them in the DAX Calculated Columns chapter.
Select Table view and select the Date table.
The first rows look like this:
| DATEDate | 123Year | ABCQuarter | 123Month Number | ABCMonth |
|---|---|---|---|---|
| Monday, January 1, 2024 | 2024 | Q1 | 1 | Jan |
| Tuesday, January 2, 2024 | 2024 | Q1 | 1 | Jan |
| Wednesday, January 3, 2024 | 2024 | Q1 | 1 | Jan |
| Thursday, January 4, 2024 | 2024 | Q1 | 1 | Jan |
| Friday, January 5, 2024 | 2024 | Q1 | 1 | Jan |
| Saturday, January 6, 2024 | 2024 | Q1 | 1 | Jan |
| Sunday, January 7, 2024 | 2024 | Q1 | 1 | Jan |
| ... | ... | ... | ... | ... |
| Wednesday, December 31, 2025 | 2025 | Q4 | 12 | Dec |
731 rows in total, from Monday, January 1, 2024 to Wednesday, December 31, 2025.
Year and Month Number are numbers, so Power BI would add them up in a visual.
Select each of them, and on the Column tools tab set Summarization to Don't summarize, as you did for OrderID.
Sort Month by Month Number
Month is a text column, so Power BI sorts it alphabetically:
Apr, Aug, Dec, Feb, Jan, Jul, Jun, Mar, May, Nov, Oct, Sep
That is not the order anyone wants.
Tell Power BI to sort Month by Month Number instead:
- Select Report view.
- In the Data pane, expand the Date table and select Month.
- On the Column tools tab, select Sort by column > Month Number.
Every visual that uses Month now shows the months in calendar order:
Jan, Feb, Mar, Apr, May, Jun, Jul, Aug, Sep, Oct, Nov, Dec
This works because each month name has exactly one month number.
Mark as Date Table
Next, tell Power BI that this table is the calendar of the model:
- In the Data pane, select the Date table.
- On the Table tools tab, select Mark as date table.
- In the dialog, turn on Mark as a date table, and in the Choose a date column list select Date.
- Power BI checks the column: unique values, no blanks, no missing days. When the check passes, the dialog shows Validated successfully. Select Save.
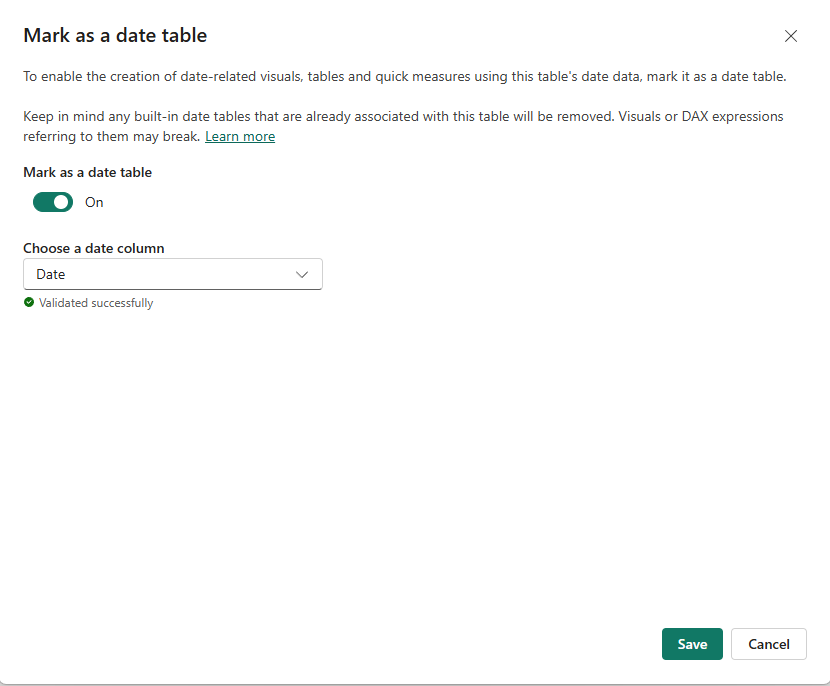
You can also right-click the Date table in the Data pane and select Mark as date table.
Marking the table does two things.
The time intelligence functions in DAX know which table and column to use.
And Power BI stops making its own hidden date table for this table.
Relate the Date Table to Sales
The Date table is not connected to anything yet.
Connect it to the Date column in Sales:
- Select Model view.
- Drag Date from the Sales table onto Date in the Date table.
- The New relationship dialog opens, with Date already selected in both tables. Select Save.
Check that the Date column in Sales has the data type Date too.
Both sides of the relationship should hold plain dates.
Double-click the new line to check its settings: Many to one (*:1) from Sales to Date, with Single cross-filter direction.
Each day appears once in Date, and on many orders in Sales.
The model now has three relationships, all pointing out from Sales:
| From (many side) | To (one side) |
|---|---|
| Sales[ProductID] | Products[ProductID] |
| Sales[StoreID] | Stores[StoreID] |
| Sales[Date] | 'Date'[Date] |
Test the relationship in Report view.
Build a table visual with Year from the Date table and Quantity from Sales:
| Year | Sum of Quantity |
|---|---|
| 2024 | 11,277 |
| 2025 | 13,211 |
| Total | 24,488 |
Each year shows its own number, so the filter travels from Date to Sales.
If both years showed 24,488, the relationship would be missing.
Turn Off Auto Date/Time
Now that the model has a real date table, turn off auto date/time for this file:
- Select File > Options and settings > Options.
- Under CURRENT FILE, select Data Load.
- In the Time intelligence section, clear the Auto date/time check box.
- Select OK.
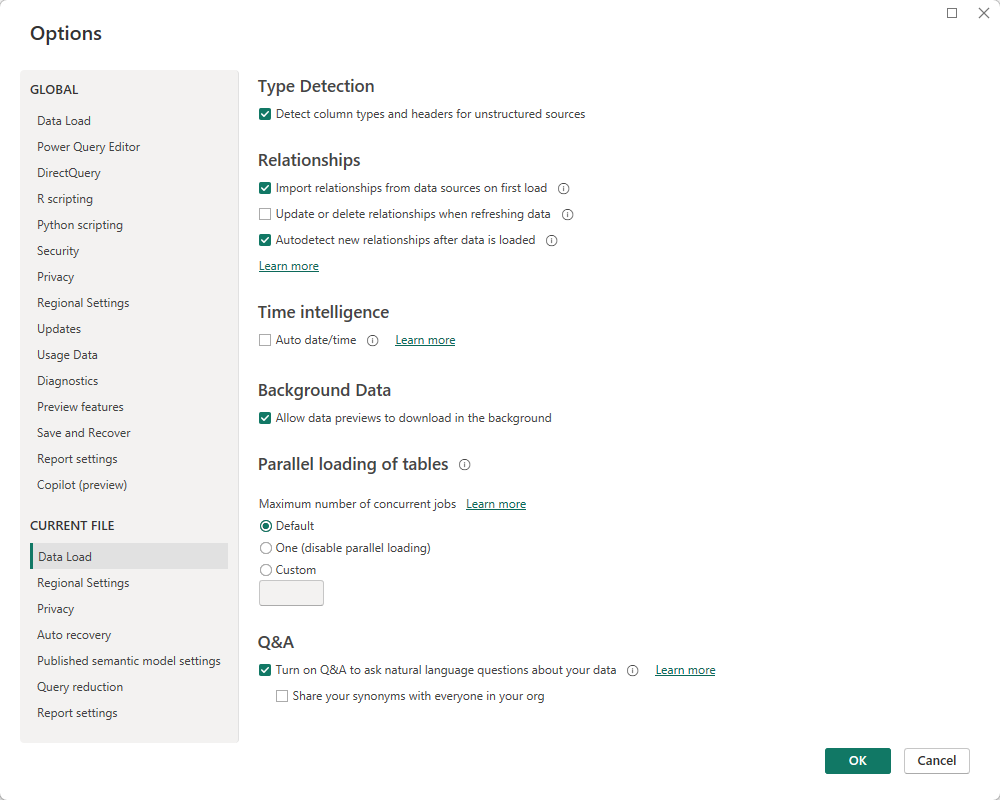
Power BI removes all the hidden date tables from the file.
From now on, all filtering and grouping by dates goes through your Date table.
Note: Turning off auto date/time can break visuals that use the automatic hierarchy, such as a line chart built on Sales[Date].
Rebuild them with Year, Quarter and Month from the Date table.
To turn the option off for all new files, clear Auto date/time for new files on the Data Load page under GLOBAL in the same dialog.
Save your file.
In the next chapter you add hierarchies, including Year > Quarter > Month in the Date table.







