
Power BI Power Query Merge Queries
What Is Missing
This page continues the cleanup from Append Queries.
Open pq_cleanup.pbix, the report you saved there, and select Home > Transform data.
The Sales query now holds all 2,740 orders of 2024 and 2025. It has the sales amount, but no product category and no cost.
That information is in a small file with one row per product:
Download poke_mart_products.csv
| ABCProduct | ABCCategory | 123UnitCost |
|---|---|---|
| Poke Ball | Balls | 110 |
| Great Ball | Balls | 330 |
| Ultra Ball | Balls | 700 |
| Potion | Medicine | 150 |
| Super Potion | Medicine | 380 |
| Hyper Potion | Medicine | 680 |
| Revive | Medicine | 900 |
| Antidote | Status Healers | 45 |
| Paralyze Heal | Status Healers | 95 |
| Awakening | Status Healers | 120 |
To bring Category and UnitCost into Sales, you merge the two queries.
A merge matches the rows of two tables on a column they have in common, here Product, and adds columns from the second table to the first.
Append and merge both combine queries.
Append adds rows: it stacks tables on top of each other.
Merge adds columns: it puts matching information side by side.
Load the Products File
- In the Power Query Editor, on the Home tab, select New Source > Text/CSV.
- Find poke_mart_products.csv and select Open.
- In the preview window, select OK.
A query called poke_mart_products appears, with 10 rows and 3 columns.
Check that UnitCost has the 123 icon (Whole Number).
Merge Queries
- Select the Sales query.
- On the Home tab, in the Combine group, select the arrow next to Merge Queries, and then select Merge Queries.
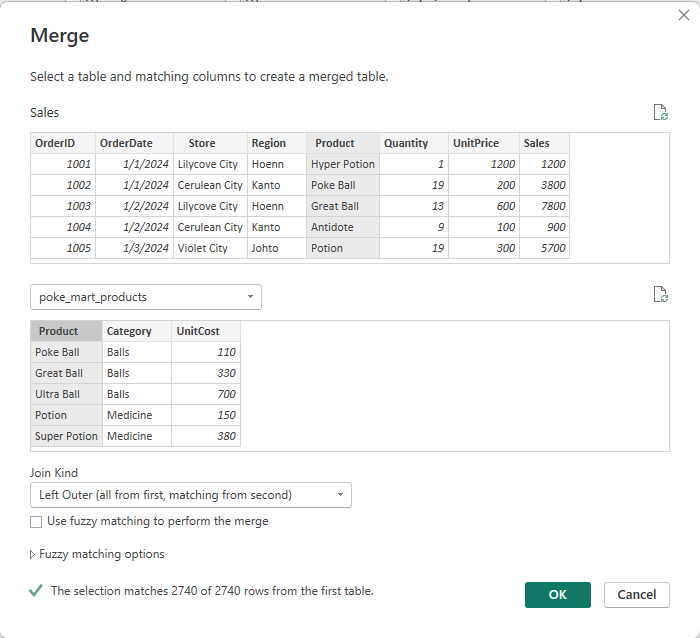
- The Merge dialog shows a preview of Sales at the top. Select the Product column header in that preview.
- In the dropdown list below it, select poke_mart_products. Then select its Product column header.
- Set Join Kind to Left Outer (all from first, matching from second). This is the default.
- At the bottom of the dialog, Power Query shows how many rows match. All rows of Sales should match: The selection matches 2740 of 2740 rows from the first table.
- Select OK.
Sales gets a new column named poke_mart_products.
Every cell in it says Table: it holds the matching row of the products table, packed into one cell.
The next step unpacks it.
Expand the New Column
- Select the expand icon (two arrows) at the right of the poke_mart_products column header.
- Clear the Product check box, so only Category and UnitCost are selected. Sales already has a Product column.
- Clear the Use original column name as prefix check box. If you leave it selected, the new columns are called poke_mart_products.Category and poke_mart_products.UnitCost.
- Select OK.
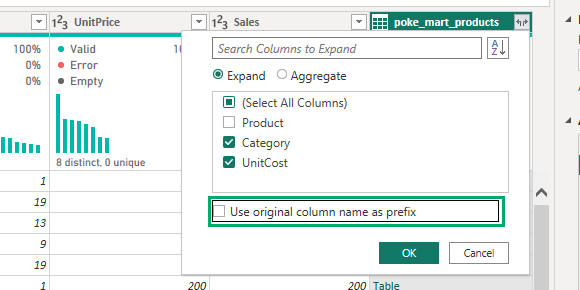
Sales now has Category and UnitCost at the end.
After the merge, the preview no longer shows the rows in OrderID order, so your first rows may be other orders.
Here are orders 1001 to 1006 (OrderDate, Store and Region are left out to save space):
| 123OrderID | ABCProduct | 123Quantity | 123UnitPrice | 123Sales | ABCCategory | 123UnitCost |
|---|---|---|---|---|---|---|
| 1001 | Hyper Potion | 1 | 1200 | 1200 | Medicine | 680 |
| 1002 | Poke Ball | 19 | 200 | 3800 | Balls | 110 |
| 1003 | Great Ball | 13 | 600 | 7800 | Balls | 330 |
| 1004 | Antidote | 9 | 100 | 900 | Status Healers | 45 |
| 1005 | Potion | 19 | 300 | 5700 | Medicine | 150 |
| 1006 | Paralyze Heal | 1 | 200 | 200 | Status Healers | 95 |
| ... | ... | ... | ... | ... | ... | ... |
Why the Cleaning Mattered
A merge finds only exact matches.
Every order finds its product, because you cleaned the Product column in Replace Values and Fill Down.
Without Trim and Capitalize Each Word, 592 of the 2,740 orders (285 from 2024 and 307 from 2025) would match nothing, and their Category and UnitCost would be null.
With Trim alone, 431 orders would still have no match.
Add the Cost Column
The cost of an order is the quantity times the unit cost:
- On the Add Column tab, select Custom Column.
- In New column name, type
Cost. - In Custom column formula, after the equal sign, enter the formula below.
- Select OK.
- The new column has the type Any, with the ABC123 icon. Select that icon in the Cost header and choose Whole Number.
Custom column formula
[Quantity] * [UnitCost]
| 123OrderID | ABCProduct | 123Quantity | ABCCategory | 123UnitCost | 123Cost |
|---|---|---|---|---|---|
| 1001 | Hyper Potion | 1 | Medicine | 680 | 680 |
| 1002 | Poke Ball | 19 | Balls | 110 | 2090 |
| 1003 | Great Ball | 13 | Balls | 330 | 4290 |
| 1004 | Antidote | 9 | Status Healers | 45 | 405 |
| 1005 | Potion | 19 | Medicine | 150 | 2850 |
| 1006 | Paralyze Heal | 1 | Status Healers | 95 | 95 |
| ... | ... | ... | ... | ... | ... |
The Sales query is finished: 2,740 rows and 11 columns.
Close & Apply
The products query is a helper too, because its columns are now in Sales.
In the Queries pane, right-click poke_mart_products and select Enable load to clear its check mark, as you did for the year queries.
Then, on the Home tab, select Close & Apply.
Power BI runs all the queries, loads the results into the report, and closes the Power Query Editor.
The Data pane shows two tables: Sales and Targets.
Select File > Save to save pq_cleanup.pbix.
Check the Result
The numbers must be the same as in the clean file poke_mart_sales.xlsx that you used in First Report.
Add a table visual with Category, Sales and Cost from the Sales table, and compare:
| Category | Sum of Sales | Sum of Cost |
|---|---|---|
| Balls | 4,447,200 | 2,477,560 |
| Medicine | 4,413,600 | 2,386,540 |
| Status Healers | 556,000 | 260,505 |
| Total | 9,416,800 | 5,124,605 |
Power BI shows these numbers without thousands separators, for example 4447200.
To check the number of rows, switch to Table view and select the Sales table.
The status bar at the bottom shows Table: Sales (2,740 rows).
The match is exact: every one of the 2,740 orders has the same date, store, region, product, quantity, price, sales and cost as in the clean file.
The only differences are the name OrderDate (Date in the clean file) and the extra UnitCost column.
Good job! You started with two messy exports and built the clean sales table yourself.
Every step is saved in the queries, so a refresh repeats the whole cleanup on new data.
Join Kinds
The Join Kind decides which rows the merge keeps.
The first table is the one at the top of the Merge dialog:
| Join kind | Keeps |
|---|---|
| Left Outer | All rows from the first table, and the matching rows from the second. Used in this chapter. |
| Right Outer | All rows from the second table, and the matching rows from the first. |
| Full Outer | All rows from both tables, matching or not. |
| Inner | Only the rows that match in both tables. |
| Left Anti | Only the rows from the first table that have no match in the second. |
| Right Anti | Only the rows from the second table that have no match in the first. |
Left Anti is a quick way to find problems.
A Left Anti merge of Sales with poke_mart_products returns the orders whose product is not in the products file.
After your cleaning, it returns no rows.
Before the cleaning, it would have returned 592.
Merge and XLOOKUP
If you know Excel, a Left Outer merge works like XLOOKUP or VLOOKUP: for each row, find a value in another table and bring back information from it. There are some differences:
- A merge can bring back many columns in one step.
- A merge is a step in the query, so it runs again at every refresh. There is no formula to copy down.
- XLOOKUP returns only the first match. If the second table has the same key twice, a merge returns both rows, and the order is repeated. Make sure the key column of the lookup table is unique. In poke_mart_products, each product appears once.
Merging is not the only way to use a products table.
You can also load it as a separate table and connect it to Sales with a relationship.
That is the idea of the star schema, which you learn in the Data Modeling chapter.







